| Previous Next Index Image Index Year Selection | |
|
|
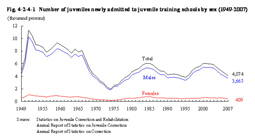
1 Juveniles newly admitted to juvenile training schools Fig. 4-2-4-1 shows the number of juveniles newly admitted to juvenile training schools by sex since 1949. The number of newly admitted juveniles increased sharply in the 1950s due to the postwar chaos of the society and economy, generally remaining in the range of 8,000 to 12,000, but continued declining after that to hit the bottom at 1,969 in 1974. The number increased and decreased since then. In the last 10 years, the number hit a peak in 2000 at 6,052 and is on a declining trend since 2001 (see Appendix 4-12). Fig. 4-2-4-1 Number of juveniles newly admitted to juvenile training schools by sex (1949–2007)
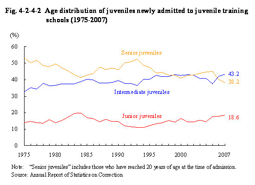
a. Age Fig. 4-2-4-2 shows the age distribution of juveniles newly admitted to juvenile training schools since 1975. Recent trends in the age distribution show that the ratio of senior juveniles declined in 2007 as did in the previous year, but the ratio of intermediate juveniles and junior juveniles rose for two consecutive years and three consecutive years respectively. No juvenile under 14 years of age were newly admitted in 2007. Fig. 4-2-4-2 Age distribution of juveniles newly admitted to juvenile training schools (1975–2007)
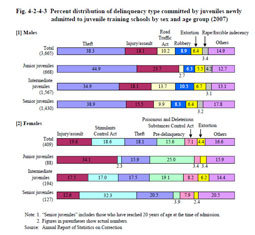
Fig. 4-2-4-3 shows the percent distribution of delinquency type committed by juveniles newly admitted to juvenile training schools in 2007 by sex and age group. For males, no significant difference can be seen in the percent distribution of delinquency type among the different age groups. For females, as the age group shifted from junior to senior, the percent ratio for injury/assault fell, and the percent ratio for Stimulants Control Act violations rose (see Appendix 4-13). Fig. 4-2-4-3 Percent distribution of delinquency type committed by juveniles newly admitted to juvenile training schools by sex and age group (2007)
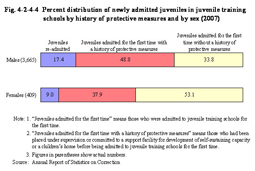
Fig. 4-2-4-4 shows the percent distribution of juveniles newly admitted to training schools in 2007 by history of protective measures and by sex. Fig. 4-2-4-4 Percent distribution of newly admitted juveniles in juvenile training schools by history of protective measures and by sex (2007)
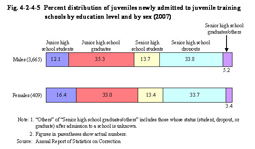
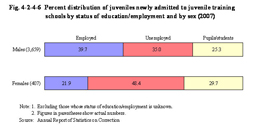
Fig. 4-2-4-5 shows the percent distribution of juveniles newly admitted to juvenile training schools in 2007 by education level and by sex and Fig. 4-2-4-6 shows that by status of education/employment and by sex. By education level, in both males and females, the percent distributions for junior high school graduates and high school dropouts are high. By status of education or employment, the percent ratios for unemployed, and pupils/students are higher and the rate for employed is lower for females than for males. Fig. 4-2-4-5 Percent distribution of juveniles newly admitted to juvenile training schools by education level and by sex (2007)
Fig. 4-2-4-6 Percent distribution of juveniles newly admitted to juvenile training schools by status of education/employment and by sex (2007)
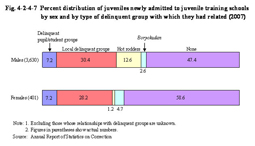
Fig. 4-2-4-7 shows the percent distribution of juveniles newly admitted to juvenile training schools in 2007 by the type of delinquent group with which they had related and by sex. In both males and females, among those who had related with delinquent groups, the percent ratios for those who had related with local delinquent groups were the highest. The percent ratio of those who had related with hot rodders was lower, and the percent ratio of those who had related with Boryokudan was higher for females than for males. Fig. 4-2-4-7 Percent distribution of juveniles newly admitted to juvenile training schools by sex and by type of delinquent group with which they had related (2007)
The percentage of juveniles newly admitted to juvenile training schools whose guardians are their biological parents was 37.7% (38.4% for males and 32.0% for females), down by nearly 1.3 points in total compared to the previous year (Source: Annual Report of Statistics on Correction). |