| Previous Next Index Image Index Year Selection | |
|
|
1 Admission and discharge Fig. 4-2-3-1 shows the number of juveniles newly admitted to juvenile classification homes since 1949. Fig. 4-2-3-1 Number of newly admitted juveniles in juvenile classification homes (1949–2007)
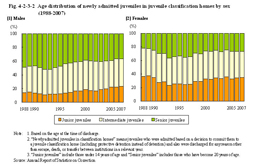
(2) Characteristics of newly admitted juveniles Fig. 4-2-3-2 shows the age distribution of newly admitted juveniles in classification homes by sex over the last 20 years. For males, the ratio of junior juveniles is on a generally upward trend. Comparison between males and females shows that the ratio of younger juveniles admitted to juvenile classification homes is higher in females. Fig. 4-2-3-2 Age distribution of newly admitted juveniles in juvenile classification homes by sex (1988–2007)
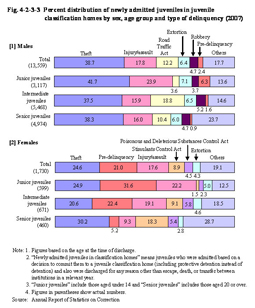
Fig. 4-2-3-3 Percent distribution of newly admitted juveniles in juvenile classification homes by sex, age group and type of delinquency (2007)
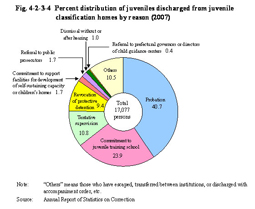
(3) Reasons for discharge Fig. 4-2-3-4 shows the percent distribution of juveniles discharged from juvenile classification homes by reason. Fig. 4-2-3-4 Percent distribution of juveniles discharged from juvenile classification homes by reason (2007)
|