| Previous Next Index Image Index Year Selection | |
|
|
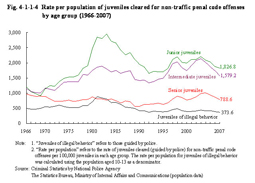
2 Trends by attribute a. Rate per population by age group Fig. 4-1-1-4 shows the rate per population of juveniles cleared for non-traffic penal code offenses by age group (including juveniles of illegal behavior guided by police) (the rate of juveniles cleared (guided by police) for non-traffic penal code offenses per 100,000 juveniles in each age group; the rate per population for juveniles of illegal behavior was calculated using the population aged 10–13 as a denominator; hereinafter the same in this chapter) by age group since 1966 (see Appendix 4-2). The rate per population of juveniles cleared by age group has constantly shown the highest proportion for junior juveniles (aged 14 to 15), followed by intermediate juveniles (aged 16 to 17), and senior juveniles (aged 18 to 19), and juveniles of illegal behavior under 14 years of age since 1984. In 2007, the rate declined in all age groups from the previous year. Fig. 4-1-1-4 Rate per population of juveniles cleared for non-traffic penal code offenses by age group (1966–2007)
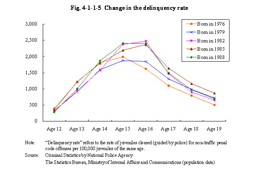
Fig. 4-1-1-5 shows how the delinquency rate (the rate of juveniles cleared or guided by police for non-traffic penal code offenses per 100,000 juveniles of the same age; hereinafter the same in this subsection) of the juveniles born in the same year changes as they grow. The figure gives the delinquency rate at age 12 to 19 for those born in 1976, 1979, 1982, 1985, and 1988. For all the birth year groups the delinquency rate is highest at the age of 15 to 16 as the delinquency rate tends to drop as the juveniles age. And the delinquency rate of those born in 1982 and later seems generally slightly higher, reaching a peak at an older age than when compared to those born earlier. Fig. 4-1-1-5 Change in the delinquency rate
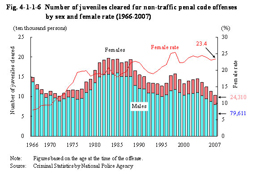
Fig. 4-1-1-6 shows the number of juveniles cleared for non-traffic penal code offenses by sex and the female rate since 1966. The female rate, viewed under a long term, has been on a rising trend, and has remained at the range of 20% since 1995. Fig. 4-1-1-6 Number of juveniles cleared for non-traffic penal code offenses by sex and female rate (1966–2007)
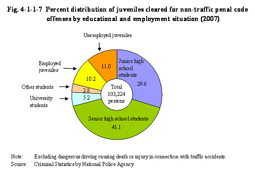
Fig. 4-1-1-7 shows the percent distribution of juveniles cleared for non-traffic penal code offenses (excluding dangerous driving causing death or injury in connection with traffic accidents; hereinafter the same in this subsection) by educational and employment situation. The ratio was the highest for senior high school students, followed by junior high school students and unemployed juveniles, in that order. There has been no significant change in the percent distribution in recent years. Fig. 4-1-1-7 Percent distribution of juveniles cleared for non-traffic penal code offenses by educational and employment situation (2007)
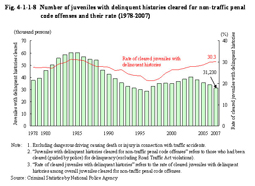
Fig. 4-1-1-8 shows the number of juveniles with delinquent histories cleared for non-traffic penal code offenses (those cleared for non-traffic penal code offenses who had been cleared (guided by police) for delinquency (excluding Road Traffic Act violations); hereinafter the same in this subsection) and their rate (the rate of those with delinquent histories among overall juveniles cleared for non-traffic penal code offenses; hereinafter the same in this subsection) over the last 30 years. The number of juveniles with delinquent histories decreased for four consecutive years since 2004, but the number of juveniles cleared for non-traffic penal code offenses was decreasing at the higher rate. Hence the rate of cleared juveniles with delinquent histories has constantly been on an upward trend since 1998. Fig. 4-1-1-8 Number of juveniles with delinquent histories cleared for non-traffic penal code offenses and their rate (1978–2007)
|