| Previous Next Index Image Index Year Selection | |
|
|
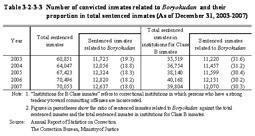
2 Correction Table 3-2-3-3 shows the number of sentenced inmates related to Boryokudan and their percent ratio compared to the number of total sentenced inmates over the last five years. Table 3-2-3-3 Number of convicted inmates related to Boryokudan and their proportion in total sentenced inmates (As of December 31, 2003–2007)
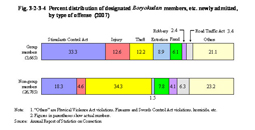
(2) Characteristics of designated Boryokudan members, in newly admitted inmates Among newly sentenced inmates admitted in 2007, 3,665 (12.0% of the total) were identified as Boryokudan members (members of designated Boryokudan under the Anti-Boryokudan Act; hereinafter the same in this subsection). Of them, 1,100 were group leaders, 2,191 were regular members, and 374 were unknown for their status in the group (Source: Annual Report of Statistics on Correction). a. Age As for the age of designated Boryokudan members, newly admitted in 2007, the largest proportion of them were aged 30–39 (37.1%), followed by aged 40–49 (25.6%), aged 20–29 (17.4%), aged 50–59 (13.9%), and aged 60 or over (6.0%) (Source: Annual Report of Statistics on Correction). b. Type of offense Figure 3–2–3–4 shows the percent distribution of designated Boryokudan members, etc. newly admitted in 2007, by type of offense. Fig. 3-2-3-4 Percent distribution of designated Boryokudan members, etc. newly admitted, by type of offense (2007)
Examining the term of sentence for designated Boryokudan members newly admitted in 2007, the largest number of them were sentenced to over one year but not more than two years (35.6%), followed by over two years but not more than three years (27.2%), over three years but not more than five years (14.2%), over six months but not more than one year (12.9 %), over five years (7.0%, including life imprisonment), and not more than six months (3.1%) (Source: Annual Report of Statistics on Correction). The rate of those sentenced to over two years but not more than three years, over three years but not more than five years, and over five years (including life imprisonment) was higher for newly admitted designated Boryokudan members than for all newly admitted sentenced inmates. d. History of imprisonment As for the history of imprisonment of designated Boryokudan members newly admitted in 2007, the highest was “the first time” with 28.4%, followed by “twice” with 20.2%, “three times” with 14.9%, “six to nine times” with 14.0%, “four times” with 10.7%, “five times” with 7.2%, and “10 times or more” with 4.6% (Source: Annual Report of Statistics on Correction). |