| Previous Next Index Image Index Year Selection | |
|
|
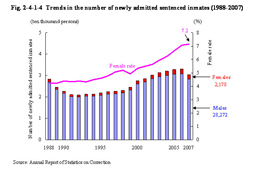
3 Trends in the number of newly admitted sentenced inmates The number of newly admitted sentenced inmates hit the bottom after the WW II at 20,864 in 1992, but has continued to increase ever since. In 2007, however, it decreased slightly. Since 2000, the rate of increase has been larger for females than for males, and the female rate in 2007 was the record high after 1946 at 7.2%. Fig. 2-4-1-4 Trends in the number of newly admitted sentenced inmates (1988–2007)
|