| Previous Next Index Image Index Year Selection | |
|
|
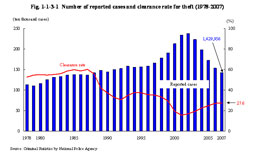
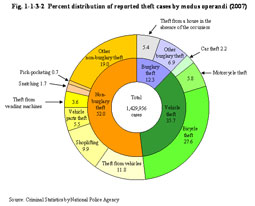
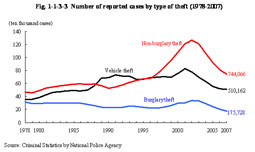
Fig. 1-1-3-1 Number of reported cases and clearance rate for theft (1978–2007) The number of reported cases for theft had been increasing and the clearance rate had been declining since 1995. However, the clearance rate has recovered since 2002 and the number of reported cases has been decreasing since 2003, so a brake was placed on this tendency.The number of reported cases had increased significantly year by year from 1998, marking the worst record of 2,377,488 cases since the end of WW II in 2002. However, the number started to decrease after that, and in 2007 it was 1,429,956 cases, a decrease of 947,532 cases (39.9%) from 2002. The number of cleared cases was 395,243 cases (down by 21,038 cases (5.1%) from the previous year), and the number of persons cleared was 180,446 persons (down by 7,208 persons (3.8%) (id.)) in 2007. The clearance rate rose by 11.9 points to 27.6% in 2007, compared to the year 2001, when the clearance rate was the lowest since the end of WW II. Fig. 1-1-3-2 shows the percent distribution of reported theft cases in 2007, by type of modus operandi. Fig. 1-1-3-2 Percent distribution of reported theft cases by modus operandi (2007) Fig. 1-1-3-3 shows the number of reported theft cases, by type of theft over the last 30 years.Fig. 1-1-3-3 Number of reported cases by type of theft (1978–2007) |


