| Previous Next Index Image Index Year Selection | |
|
|
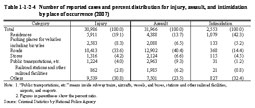
4 Injury, assault and intimidation Table 1-1-2-4 shows the number of cases reported and the percent distribution for injuries, assault and intimidation by place of occurrence. The number of cases reported for injury and assault was the highest on the roads, followed by residences, for place of occurrence. It is also noticeable that a large number of cases were reported to have taken place at parking places for vehicles, including bicycles, for injuries, and at public transportation facilities (inside subway trains, aircraft, ships, and buses, stations and other railroad facilities, airports, and seaports) for assault. The majority of reported cases for intimidation have taken place at residences. Table 1-1-2-4 Number of reported cases and percent distribution for injury, assault, and intimidation by place of occurrence (2007) |
