| Previous Next Index Image Index Year Selection | |
|
|
8 Family and employment status
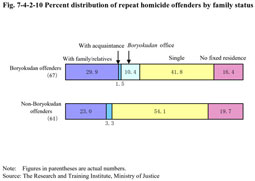
Fig. 7-4-2-10 shows the percent distribution of repeat homicide offenders by family status. With overall repeat homicide offenders, there were 61 offenders (47.7%) who were single, comprising of nearly half of the entire offenders. The ratio of those who were single was particularly high at 54.1% with non-Boryokudan offenders.
Fig. 7-4-2-10 Percent distribution of repeat homicide offenders by family status
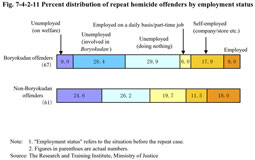
45 offenders (67.2%) were unemployed among Boryokudan offenders, while 31 (50.8%) were unemployed among non-Boryokudan offenders. With Boryokudan offenders, the ratios of those unemployed and self-employed were higher when compared to non-Boryokudan offenders, while those of those employed and employed on a daily basis/part-time were lower. Fig. 7-4-2-11 Percent distribution of repeat homicide offenders by employment status
As for the level of intelligence, those with an IQ of 69 or lower were the most common with 53 offenders (41.4%), followed by 30 offenders (23.4%) with IQ in the 70 range, 22 offenders (17.2%) in the 80 range. As for academic background, junior high school graduates and drop-outs were the most common with 80 offenders (62.5%), followed by senior high school graduates and drop-outs with 31 offenders (24.2%). One of the reasons for the considerable number of those without completing compulsory education was that many of the repeat homicide offenders were elderly. |