| Previous Next Index Image Index Year Selection | |
|
|
This section provides an overview of recent trends with repeat offenses.
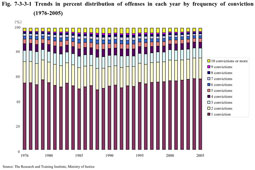
Fig. 7-3-3-1 shows the changes over the last thirty years in the distribution of recorded convictions by type of offense using the One Million Recorded Convictions and in order to reveal the most prevalent offense each year. Fig. 7-3-3-1 Trends in percent distribution of offenses in each year by frequency of conviction (1976-2005)
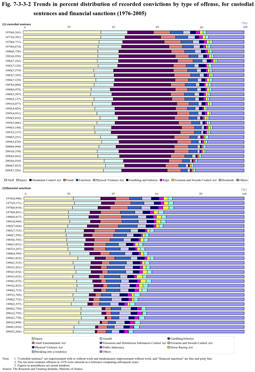
Fig. 7-3-3-2 shows the changes over the last thirty years in the distribution of offenses of each year using the One Million Non-Repeat and Repeat Offenders' Recorded Convictions. An attempt was made to determine the characteristics of the distribution of offenses (i.e., what the major offenses were) using offenses punished by custodial sentences and financial sanctions. Fig. 7-3-3-2 Trends in percent distribution of recorded convictions by type of offense, for custodial sentences and financial sanctions (1976-2005)
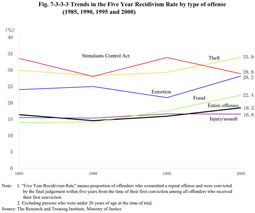
In regard to the trends with financial sanctions (fines or petty fines), injury has always accounted for the highest proportion, at 19% to 26%, while assault and violations of the Adult Entertainment Act have remained in relatively high positions. Most injury cases resulting in financial sanctions were heard in summary procedures and were relatively minor. In order to examine trends in recidivism by type of offense for which offenders were first convicted, follow up observations were made on offenders receiving their first conviction in 1985, 1990, 1995 and 2000 for the offenses specified in Fig. 7-3-3-3 and traced over five years (hereinafter referred to as the “Five Year Recidivism Rate”) based upon the One Million Non-Repeat and Repeat Offenders' Recorded Convictions. Fig. 7-3-3-3 Trends in the Five Year Recidivism Rate by type of offense (1985, 1990, 1995 and 2000)
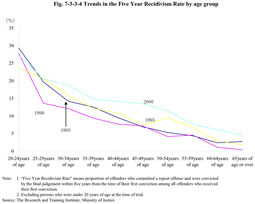
Regarding the Five Year Recidivism Rate for offenders who received their first conviction, as a proportion of all offenses, it was at its lowest at 14.6% in 1990, 15.9% in 1995, 16.4% in 1985, and 18.5% in 2000 respectively. In regard to the Five Year Recidivism Rate for offenses, it was found that theft and violation of the Stimulants Control Act have remained at constantly high levels. A comparison of 1995 and 2000 reveals deterioration in the Five Year Recidivism Rate for extortion and fraud with an increasing rate for extortion of 6.6 points and fraud 4.8 points, respectively. Table 7-3-3-4 shows trends in the Five Year Recidivism Rate in the pertinent years by age group based upon the One Million Non-Repeat and Repeat Offenders' Recorded Convictions. Fig. 7-3-3-4 Trends in the Five Year Recidivism Rate by age group
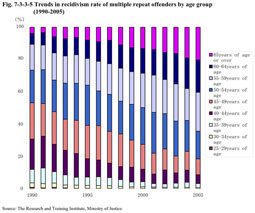
The Five Year Recidivism Rate of the offenders receiving their first conviction in 2000 was higher than in other years for all age groups except offenders in their twenties. Special attention should also be paid to those in their forties as they show a noticeable tendency to have such an increase. As mentioned in Section 2 of this Chapter, multiple repeat offenders account for 0.8% of all repeat offenders but are responsible for 6.4% of all recorded offenses. Fig. 7-3-3-5 shows the trends in the recidivism rate of multiple repeat offenders by age group based upon the 500,000 Repeat Offenders' Criminal Records. Fig. 7-3-3-5 Trends in recidivism rate of multiple repeat offenders by age group (1990-2005)
|