| Previous Next Index Image Index Year Selection | |
|
|
1 Stimulants Control Act violations
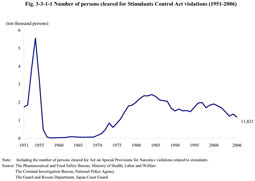
Fig. 3-3-1-1 shows the number of persons cleared for Stimulants Control Act (Act No. 252 of 1951) violations (including Act on Special Provisions for Narcotics violations related to stimulants; hereinafter the same in this chapter) since 1951.
Stimulants abuse began to become widespread during the chaotic postwar period, however, persons cleared fell sharply after a peak over 50,000 in 1954. As a background, it has been pointed out that penal regulations were tightened, that clearance by police was implemented thoroughly, and that educational campaigns concerning the harmful influence of stimulants were held nationally. However, the number of persons cleared took an upward turn again in 1970 and reached 24,372 in 1984, recording the second peak. Since then, the number fell below 20,000 in 1989 and had leveled off until 1994. It started to increase again in 1995 and reached almost 20,000 in 1997 and 2000. Since 2001, it has generally been on a decreasing trend. Fig. 3-3-1-1 Number of persons cleared for Stimulants Control Act violations (1951-2006)
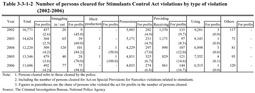
Table 3-3-1-2 Number of persons cleared for Stimulants Control Act violations by type of violation (2002-2006)
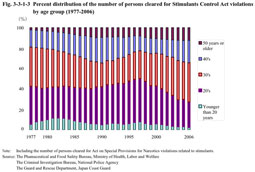
The ratio of those aged 30-39 was the highest from 1977 to 1984, while that of those aged 20-29 was the highest since 1985. However, the proportion of those aged 30-39 is the highest again since 2002. Fig. 3-3-1-3 Percent distribution of the number of persons cleared for Stimulants Control Act violations by age group (1977-2006)
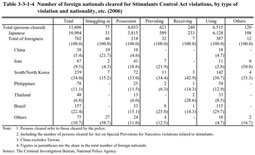
Table 3-3-1-4 Number of foreign nationals cleared for Stimulants Control Act violations, by type of violation and nationality, etc. (2006)
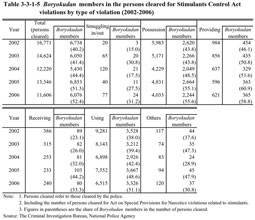
The percent ratio of Boryokudan members to total persons cleared has been on the rise since 2003, exceeded 50% in 2005, and reached 52.4% in 2006. By type of violation, the percentage of Boryokudan members was the largest every year for providing stimulants, followed by possession, which indicates that they are deeply involved in illicit sales of stimulants. Table 3-3-1-5 Boryokudan members in the persons cleared for Stimulants Control Act violations by type of violation (2002-2006)
|