| Previous Next Index Image Index Year Selection | |
|
|
2 Firearm offenses
(1) Antagonistic fights and firing incidents
Fig. 3-2-2-3 shows the number of antagonistic fights amongst Boryokudan groups and the rate of using firearms (firearms mean handguns, rifles, machine guns, cannons, hunting rifles and other guns which have the function of firing metal bullets, and air guns; hereinafter the same.) (the rate of frequency in the usage of firearms in comparison to the total number of antagonistic fights) over the last ten years is covered. There were no antagonistic fights among Boryokudan groups in 2006. Fig. 3-2-2-3 Number of antagonistic fights and the rate of using firearms (1997-2006)
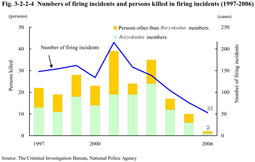
Fig. 3-2-2-4 Numbers of firing incidents and persons killed in firing incidents (1997-2006)
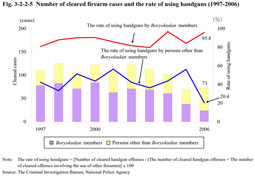
Fig. 3-2-2-5 shows the number of cleared firearm cases and the rate of using handguns over the last 10 years. Fig. 3-2-2-5 Number of cleared firearm cases and the rate of using handguns (1997-2006)
Fig. 3-2-2-6 shows the number of handguns seized over the last 10 years. Fig. 3-2-2-6 Number of seized handguns (1997-2006)
Breaking down the country of manufacture for the genuine 407 handguns seized in 2006, the U.S.A. had the largest share with 107, followed by Japan with 68, Philippines with 41, Belgium with 32, Russia with 21, China with 19, and Brazil with 15 (Source: The Criminal Investigation Bureau, National Police Agency). |