| Previous Next Index Image Index Year Selection | |
|
|
1 Transnational fugitives from Japan
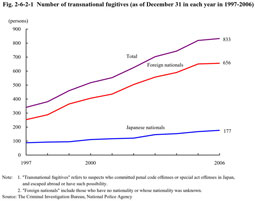
Fig. 2-6-2-1 shows the trends (the last 10 years) in the number of transnational fugitives (suspects who committed penal code offenses or special act offenses in Japan, and escaped abroad or have such possibility; hereinafter the same in this section.)
Fig. 2-6-2-1 Number of transnational fugitives (as of December 31 in each year in 1997-2006)
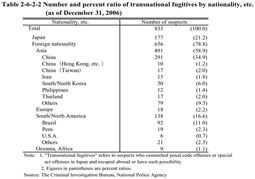
Table 2-6-2-2 Number and percent ratio of transnational fugitives by nationality, etc. (as of December 31, 2006)
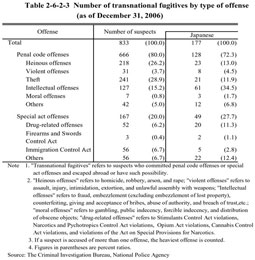
Table 2-6-2-3 Number of transnational fugitives by type of offense (as of December 31, 2006)
|