| Previous Next Index Image Index Year Selection | |
|
|
1 Probationers / parolees under supervision
(1) Trends in the numbers of newly received probationers/parolees
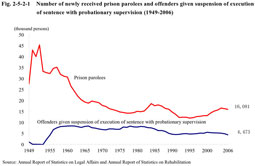
Fig. 2-5-2-1 shows the trends in the numbers of prison parolees and offenders given suspension of execution of sentence with probationary supervision newly received by probation offices since 1949. The number of newly received prison parolees had been on an upward trend since 1996, but slightly decreased consecutively in 2005 and 2006 from the previous year. The number of offenders given suspension of execution of sentence with probationary supervision has been decreasing since 2001. Fig. 2-5-2-1 Number of newly received prison parolees and offenders given suspension of execution of sentence with probationary supervision (1949-2006)
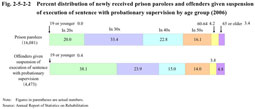
(2) Characteristics of probationers/parolees a. Age Fig. 2-5-2-2 shows the percent distribution of prison parolees and offenders given suspension of execution of sentence with probationary supervision newly received in 2006, by age group. Fig. 2-5-2-2 Percent distribution of newly received prison parolees and offenders given suspension of execution of sentence with probationary supervision by age group (2006)
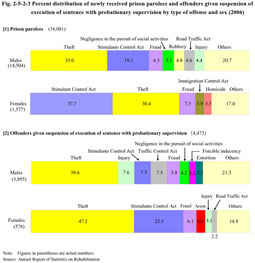
Fig. 2-5-2-3 shows the percent distribution of prison parolees and offenders given suspension of execution of sentence with probationary supervision newly received in 2006, by type of offense and sex. The percent ratio was high for theft and Stimulants Control Act violations among both sexes and both prison parolees and offenders given suspension of execution of sentence with probationary supervision. Furthermore, the percent ratio was also relatively high for injury among male offenders given suspension of execution of sentence with probationary supervision. Fig. 2-5-2-3 Percent distribution of newly received prison parolees and offenders given suspension of execution of sentence with probationary supervision by type of offense and sex (2006)
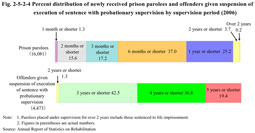
Fig. 2-5-2-4 shows the percent rate of newly received prison parolees and offenders given suspension of execution of sentence with probationary supervision by supervision period in 2006. Supervision periods for most of the offenders given suspension of execution of sentence with probationary supervision were over two years, while those for parolees were much shorter and were six months or shorter for more than 70% of them. Fig. 2-5-2-4 Percent distribution of newly received prison parolees and offenders given suspension of execution of sentence with probationary supervision by supervision period (2006)
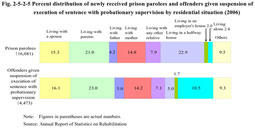
Fig. 2-5-2-5 shows the percent distribution of prison parolees and offenders given suspension of execution of sentence with probationary supervision newly received in 2006, by residential situation. The percent ratio of those living in halfway houses was highest among prison parolees, while the largest proportion of offenders given suspension of execution of sentence with probationary supervision lived with parents. Fig. 2-5-2-5 Percent distribution of newly received prison parolees and offenders given suspension of execution of sentence with probationary supervision by residential situation (2006)
|