| Previous Next Index Image Index Year Selection | |
|
|
4 Characteristics of newly admitted sentenced inmates
(1) Age
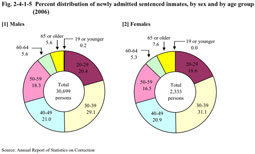
Fig. 2-4-1-5 shows the percent distribution of newly admitted sentenced inmates in 2006 by sex and age group. The rate of 30 to 39 years old was the highest both for males and females. Fig. 2-4-1-5 Percent distribution of newly admitted sentenced inmates, by sex and by age group (2006)
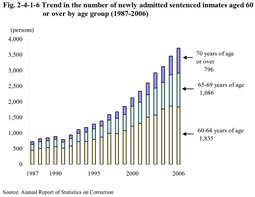
Fig. 2-4-1-6 Trend in the number of newly admitted sentenced inmates aged 60 or over by age group (1987-2006)
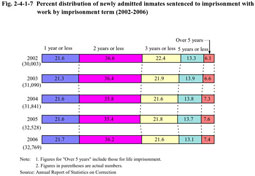
(2) Type of offenses In examination of offenses committed by newly admitted sentenced inmates in 2006, the following five offenses had high percentages for male inmates: (1) theft (30.0%), (2) Stimulants Control Act violations (19.6%), (3) fraud (7.7%), (4) Road Traffic Act violations (5.9%), and (5) injury (5.6%). The following five offenses had high percentages for female inmates: (1) Stimulants Control Act violations (33.6%), (2) theft (31.9%), (3) fraud (6.5%), (4) Immigration Control Act violations (4.8%), and (5) Homicide (4.0%) (see Appendix 2-6). For male sentenced inmates, theft accounted for the highest percentage, followed by Stimulants Control Act violations. This pattern has continued since 1998. For female sentenced inmates, the percentage for Stimulants Control Act violations has been the highest since 1978. (3) Type of sentence and term of imprisonment By type of sentence of newly admitted inmates in 2006, 32,769 persons (99.2%) were sentenced to imprisonment with work, 245 persons (0.7%) were sentenced to imprisonment without work, and 14 persons to misdemeanor detention without work. A death penalty was executed for four inmates in 2006. Fig. 2-4-1-7 shows the percent distribution of newly admitted inmates sentenced to imprisonment with work by imprisonment term over the last five years. Percent ratio of inmates sentenced to imprisonment for “over one year but two years or less” was the highest of all every year, while that of those sentenced to imprisonment for over 2 years, which was on a rising trend until the previous year, slightly declined in 2006 (see Appendix 2-10 for the trend in the number of inmates sentenced to imprisonment with work at the year-end, by imprisonment term). Fig. 2-4-1-7 Percent distribution of newly admitted inmates sentenced to imprisonment with work by imprisonment term (2002-2006)
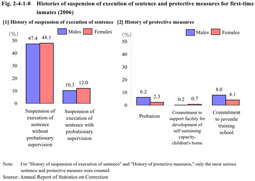
(4) History of offenses The percentage of first-time inmates (persons imprisoned for the first time; hereinafter the same) in all those newly admitted has been over 50% since 2001, but in 2006, the percentage of first-time inmates was 50.0%, almost half of them (see Appendix 2-8 for the number of times in imprisonment for newly admitted inmates by type of offense). Fig. 2-4-1-8 shows the histories of suspension of execution of sentence and protective measures of 16,504 first-time inmates (14,885 males and 1,619 females) newly imprisoned in 2006. Fig. 2-4-1-8 Histories of suspension of execution of sentence and protective measures for first-time inmates (2006)
|