| Previous Next Index Image Index Year Selection | |
|
|
3 Reported cases for non-traffic penal code offenses excluding theft
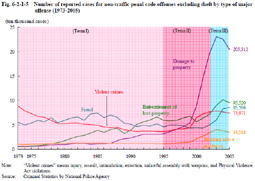
Changes in the number of reported cases for non-traffic penal code offenses excluding theft did not have much influence on the overall trend in Terms I and II. However, their ratio among the total number of reported cases for non-traffic penal code offenses, which was 18.2% in 1973, 11.9% in 1995, and 16.7% in 2002, increased to 24.0% in 2005, showing an upward trend in Term III. Their changes came to have larger impact on the overall trend.
Fig. 6-2-1-5 shows trends in the number of reported cases for non-traffic penal code offenses excluding theft by type of major offense. Fig. 6-2-1-5 Number of reported cases for non-traffic penal code offenses excluding theft by type of major offense (1973-2005)
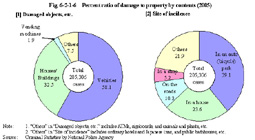
We will examine the details of damage to property, which was the major cause of the sharp increase of the total number of reported cases for non-traffic penal code offenses excluding theft in Term II. Fig. 6-2-1-6 shows the percent ratio of damage to property by contents in 2005. Fig. 6-2-1-6 Percent ratio of damage to property by contents (2005)
In Term III, such offenses targeting vehicles seem to be declining due to strengthened countermeasures, but the number of other offenses has mostly remained at a high level. In particular, assault and fraud continued to increase even in 2005 (see Part 1, Chapter, 1, Section 1, 1), and the overall situation concerning crimes is still far from an improvement. Furthermore, we should note the appearance of an advanced information society which has brought about new types of offenses utilizing cellular phones, the Internet, and other new technologies. Counterfeiting of currencies utilizing PCs and fraud utilizing the Internet, as well as billing fraud are increasing significantly in recent years (see Part 1, Chapter 1, Section 2 and Part 1, Chapter 3, Section 3). There has also been a phenomenon that offenses likely to inspire copycats such as robbery targeting convenient stores, street robbery, and robbery at financial institutions increase significantly nationwide in a short period of time. In order to prevent such new offenses emerging one after another, swift and effective countermeasures are strongly required. |