| Previous Next Index Image Index Year Selection | |
|
|
1 Overview
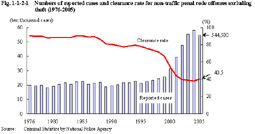
Fig. 1-1-2-1 shows the numbers of reported cases and clearance rate for non-traffic penal code offenses excluding theft over the last 30 years.
The number of cases reported for non-traffic penal code offenses excluding theft has increased rapidly since 2000 and reached the post WWII high at 581,463 in 2004. However, it decreased by 36,963 cases (6.4%) from the previous year in 2005. Compared to the previous year, the number of cleared cases increased by 804 cases (0.4%) to 220,744 cases, while the number of persons cleared decreased by 1,031 persons (0.5%) to 193,115 persons in 2005. The clearance rate, which used to be around 90%, has declined sharply in recent years, registering the lowest level in the post WWII period at 37.8% in 2004. However, it recovered slightly to 40.5% (up by 2.7 points from the previous year) in 2005. Fig. 1-1-2-1 Numbers of reported cases and clearance rate for non-traffic penal code offenses excluding theft (1976-2005)
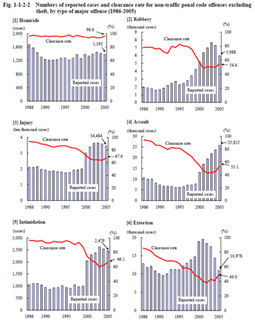
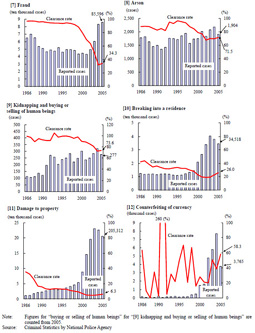
Fig. 1-1-2-2 Numbers of reported cases and clearance rate for non-traffic penal code offenses excluding theft, by type of major offense (1986-2005)
|