| Previous Next Index Image Index Year Selection | |
|
|
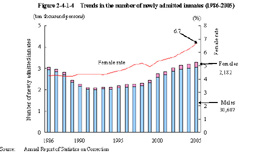
3 Trend in number of newly admitted inmates Fig. 2-4-1-4 shows the trend of the number of newly admitted inmates over the last 20 years.
The number of newly admitted inmates hit the bottom after the WW II at 20,864 in 1992, but has continued to increase ever since. Since 2000, the rate of increase has been larger for females than for males, and the female rate in 2005 was the record high after 1946 at 6.7%, up by 0.4 points from the previous year (See Appendix 2-6) Figure 2-4-1-4 Trends in the number of newly admitted inmates (1986-2005)
|