| Previous Next Index Image Index Year Selection | |
|
|
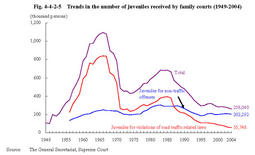
2 Disposition in family courts (1) Juveniles received by family courts Fig.4-4-2-5 shows the number of juvenile offenders received by family courts since1949.
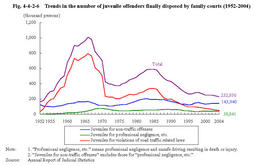
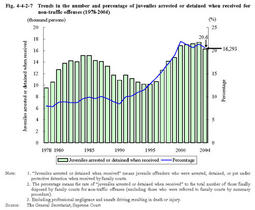
Fig.4-4-2-5 Trends in the number of juveniles received by family courts(1949-2004) Fig.4-4-2-6 Trends in the number of juvenile offenders finally disposed by family courts(1952-2004) (2) Hearing a. Arrested or detained juveniles Fig.4-4-2-7 shows the number and percentage of juveniles(excluding those referred by summary procedure)arrested or detained when received(juveniles who were arrested,detained,or put under protective detention when they were referred to family courts;hereinafter the same in this subsection)for non-traffic offenses.The percentage is the rate of juveniles arrested or detained when received to the total number of those finally disposed by family courts for non-traffic offenses(hereinafter the same in this subsection).
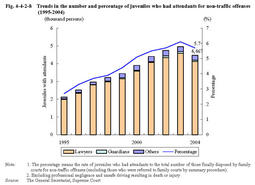
By type of offense,the percentage was the highest for Stimulants Control Law violations(92.6%),followed by rape(87.5%),homicide(87.2%),robbery(84.4%),Narcotics and Psychotropics Control Law violations(83.6%),Anti-Prostitution Law violations(83.3%),and Immigration Control Law violations(81.4%)in2004.Although the percentage for larceny was low at17.2%,the number of juveniles arrested or detained for larceny when received was the highest,accounting for44.7%of the total number of juveniles arrested or detained when received(Source:Annual Report of Judicial Statistics). Fig.4-4-2-7 Trends in the number and percentage of juveniles arrested or detained when received for non-traffic offenses(1978-2004) b. Selection of an attendant Fig.4-4-2-8 shows the number and percentage of juveniles who had attendants for non-traffic offenses finally disposed by family courts(excluding those who were referred to family courts by summary procedure)since1995.The percentage is the rate of juveniles who had attendants to the total of those finally disposed by family courts(hereinafter the same in this subsection).
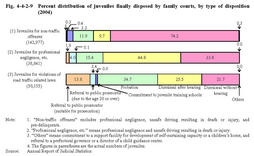
More than90%of attendants were lawyers every year,and in2004,92.5%were lawyers.The percentage was the highest for homicide(72.3%),followed by rape(55.4%)and robbery(37.7%)(Source:Annual Report of Judicial Statistics). Fig.4-4-2-8 Trends in the number and percentage of juveniles who had attendants for non-traffic offenses(1995-2004) (3) Disposition of juvenile cases in family courts a. Outline of final disposition Fig.4-4-2-9 shows the percent distribution of juveniles finally disposed for(i)non-traffic offenses(excluding pre-delinquents),(ii)professional negligence,etc.,and(iii)violations of road traffic related laws in2004(see Appendix4-10 ).
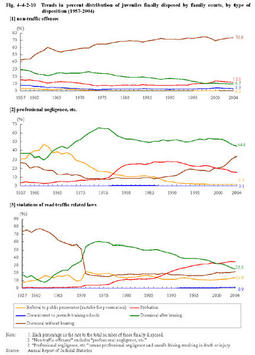
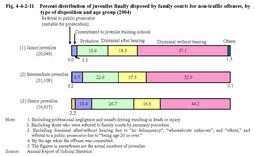
Fig.4-4-2-9 Percent distribution of juveniles finally disposed by family courts,by type of disposition(2004) For cases for professional negligence,etc.,probation has increased significantly since1977,when the system of short-term probation for traffic offenses was introduced. For cases for violations of road traffic related laws,dismissals without hearing decreased and dismissals after hearing increased sharply in1970,when the traffic violation notification system came to be adapted to juveniles. Fig.4-4-2-10 Trends in percent distribution of juveniles finally disposed by family courts,by type of disposition(1957-2004) b. Disposition by age group Fig.4-4-2-11 shows the percent distribution of juvenile cases finally disposed in2004for non-traffic offenses(excluding those related to summary sending),by disposition and age group(age when committing the offense).
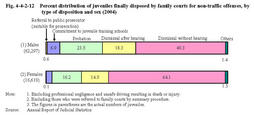
Fig.4-4-2-11 Percent distribution of juveniles finally disposed by family courts for non-traffic offenses,by type of disposition and age group(2004) c. Disposition by sex Fig.4-4-2-12 shows the percent distribution of juveniles finally disposed by family courts for non-traffic offenses,by type of disposition and sex in2004.
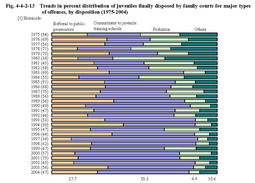
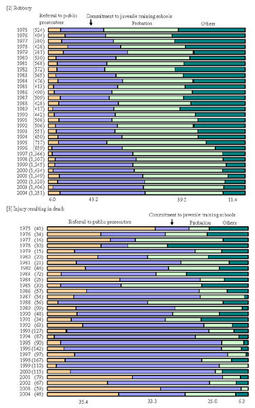
Fig.4-4-2-12 Percent distribution of juveniles finally disposed by family courts for non-traffic offenses,by type of disposition and sex(2004) d. Disposition by type of offense Fig.4-4-2-13 shows the percent distribution of juveniles finally disposed by family courts(excluding referral to a public prosecutor due to being age20or over)for(i)homicide,(ii)robbery,(iii)injury resulting in death,(iv)Stimulants Control Law violations,and(v)pre-delinquency,over the last30years.
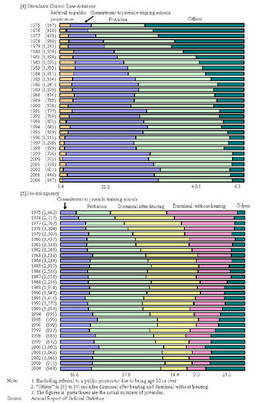
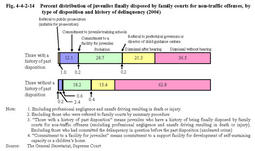
For homicide,commitment to a juvenile training school has a high percentage.Referral to a public prosecutor(limited to those suitable for prosecution;hereinafter the same in this subsection(3)-d)also has a high percentage.The total of commitment to a juvenile training school and referral to a public prosecutor accounts for a range of70%to80%.As homicide here includes attempts,the figures include a considerable number of cases that were not required to be referred to public prosecutors in principle under the Juvenile Law(see 4(1)-b of this Section). For robbery,probation has had the highest percentage in most years,but the percentage of commitment to a juvenile training school has been on a rise,surpassing that of probation since2002.The total of referral to a public prosecutor and commitment to a juvenile training school accounts for nearly half of the total. For injury resulting in death,the percentage of referral to a public prosecutor used to be lower than that of commitment to a juvenile training school in most years,but has shown an increase since2001. For Stimulants Control Law violations,probation used to have the highest percentage.However,the percentage of commitment to a juvenile training school has been higher than that of probation since1999. For pre-delinquency,probation has had the highest percentage since1982.The total percentage of probation and commitment to a juvenile training school has been over50%in recent years. Fig.4-4-2-13 Trends in percent distribution of juveniles finally disposed by family courts for major types of offenses,by disposition(1975-2004) e. Disposition by history of delinquency Fig.4-4-2-14 shows the percent distribution of juveniles finally disposed by family courts(excluding referral to a public prosecutor due to being age20or over)for non-traffic offenses in2004,by history of past disposition.
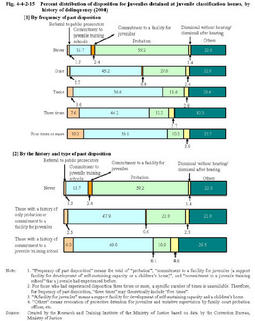
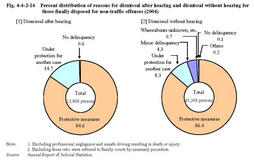
Compared with juveniles without a history of past disposition,those with a history of past disposition show a1.6times higher percentage for probation,and about five times higher percentages for referral to a public prosecutor(suitable for prosecution)and commitment to a juvenile training school. Fig.4-4-2-14 Percent distribution of juveniles finally disposed by family courts for non-traffic offenses,by type of disposition and history of delinquency(2004) As is seen in Fig.[1],juveniles with a higher frequency of past disposition show higher percentages for referral to a public prosecutor and commitment to a juvenile training school,and a lower percentage for probation. As is seen in Fig.[2],juveniles with a history of only probation or commitment to a facility for juveniles show higher percentages for referral to a public prosecutor and commitment to a juvenile training school and a lower percentage for probation than those without a history of protective measures.Juveniles who had been sent to a juvenile training school showed higher percentages for referral to a public prosecutor and commitment to a juvenile training school and a lower percentage for probation than those with a history of only probation or commitment to a facility for juveniles. Fig.4-4-2-15 Percent distribution of disposition for juveniles detained at juvenile classification homes,by history of delinquency(2004) f. Dismissal after hearing/dismissal without hearing Fig.4-4-2-16 shows the percent distribution of reasons for dismissal after hearing and dismissal without hearing for juveniles finally disposed for non-traffic offenses in2004.
More than80%of dismissal after hearing and dismissal without hearing were due to"protective measures"taken in the process of the investigation and hearing."Under protection for another case,"which accounts for nearly10%of both dismissal after hearing and dismissal without hearing,refers to cases where protective measures have been taken for another case and t he continuation of the measures is considered to be enough. Juvenile cases under suspicion of an offense,all of which are referred to family courts,include many cases that would be disposed as minor offenses or granted suspension of prosecution if they were adult cases.Therefore,considering the character and environmental situation of juveniles,a family court will dismiss a case without hearing on the grounds of being"minor delinquency,"if it finds little tendency to delinquency and no need for protective measures.Minor cases for non-traffic offenses by juveniles are often referred to family courts by summary procedure,and usually dismissed without hearing due to"minor delinquency." 89juveniles were granted dismissal after hearing,and43were granted dismissal without hearing on the ground that"no delinquency was found,"the total of which accounted for0.2%of all those finally disposed(excluding those who were referred to family courts by summary procedure). Fig.4-4-2-16 Percent distribution of reasons for dismissal after hearing and dismissal without hearing for those finally disposed for non-traffic offenses(2004) |