| Previous Next Index Image Index Year Selection | |
|
|
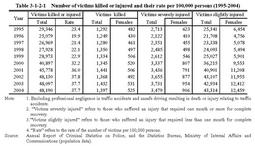
Table3-1-2-1 shows the number of victims who were killed or injured in non-traffic penal code offenses and their rate per100,000persons over the last10years.
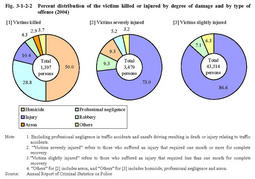
Table3-1-2-1 Number of victims killed or injured and their rate per100,000persons(1995-2004) Fig.3-1-2-2 Percent distribution of the victims killed or injured by degree of damage and by type of offense(2004) |