| Previous Next Index Image Index Year Selection | |
|
|
1 Recent trends in victims, by gender and age As broadly outlined in Chapter 2, Section 2-2 from the perspective of the relationship between the victim and the perpetrator, changes have been seen in the composition of the victims of heinous offenses in recent years. In this section, we will further examine these changes by gender, age group, and household composition (victims in this section refer to the principal victims involved in the reported cases).
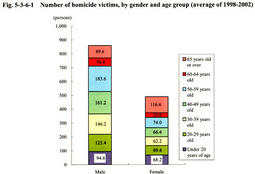
(1) Homicide victims Fig. 5-3-6-1 shows the average number of homicide victims from 1998 to 2002, by gender and age group. The number of male victims was 1.8 times larger than that of female victims. Most male victims were in their 50s, followed by those in their 40s, 60s, 30s, 20s, and under 20, without significant gap among age groups. Among female victims, on the other hand, those in their 60s accounted for 30.5% of the total (those aged 65 or over accounting for 23.8%) whereas those in other age groups accounted for 10%-20% respectively, with those in their 30s staying at a level slightly fewer than those in other age groups. Thus, the share of elderly people was larger.
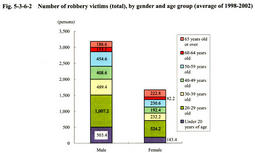
(2) Robbery victims Fig. 5-3-6-2 shows the average number of robbery victims (total) from 1998 to 2002, by gender and age group. The number of male victims was 1.9 times larger than that of female victims. Most male victims were in their 20s, followed by those under 20, 30s, 50s, 40s, and 60 or over. Yong people under 30 accounted for almost half of the total number. Among female victims, those in their 20s accounted for the largest share, followed by those aged 60 or over, 30s, 50s, 40s, and under 20. Young people accounted for 42.4% while elderly people aged 60 or over accounting for 18.3%.
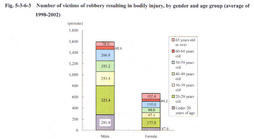
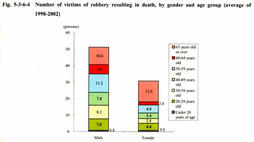
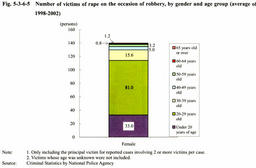
Fig. 5-3-6-3 , Fig. 5-3-6-4 , and Fig. 5-3-6-5 show the average number of victims of robbery resulting in bodily injury, robbery resulting in death, and rape on the occasion of robbery from 1998 to 2002, by gender and age group. The trend in the number of victims of robbery resulting in bodily injury was almost the same as that of robbery victims in total. The number of male victims was 2.4 times larger than that of female victims. Among male victims, young people under 30 accounted for more than half. Among female victims, on the other hand, young people accounted for 33.8% while elderly people aged 60 or over accounted for 21.5%. Thus, the share of elderly people was larger than that among robbery victims in total. As for victims of robbery resulting in death, the number of male victims was 1.7 times larger than that of female victims, the difference being smaller than that for those mentioned above. Most male victims were aged 60 or over, accounting for 31.6%, followed by those in their 50s. The number of those in these two age groups accounted for more than half. Among female victims, most of them were aged 60 or over, accounting for 47.4%. Thus, the share of elderly people was much larger than that among victims of robbery resulting in bodily injury. As for victims of rape on the occasion of robbery, most of them were in their 20s, followed by those under 20. Young people in these two age groups accounted for more than 80%. The above analysis indicates the salient feature that young people accounted for large shares in the number of victims of robbery (total), robbery resulting in bodily injury, and rape on the occasion of robbery whereas most of victims of robbery resulting in death, which is more malicious offense, were elderly people, and in particular female elderly people. Fig. 5-3-6-1 Number of homicide victims, by gender and age group (average of 1998-2002) Fig. 5-3-6-2 Number of robbery victims (total), by gender and age group (average of 1998-2002) Fig. 5-3-6-3 Number of victims of robbery resulting in bodily injury, by gender and age group (average of 1998-2002) Fig. 5-3-6-4 Number of victims of robbery resulting in death, by gender and age group (average of 1998-2002) Fig. 5-3-6-5 Number of victims of rape on the occasion of robbery, by gender and age group (average of 1998-2002) |
