| Previous Next Index Image Index Year Selection | |
|
|
1 Overall trends The previous sections have examined overall trends in the attributions of offenders by making comparison with the past. However, due to the difference among prefectures with respect to population, age composition, and economic and social infrastructures, the trends in the occurrence of crimes may not be the same throughout Japan but may vary depending on the region. From this perspective, this section will overview the trends over 10 or 20 years in the occurrence of heinous offenses, by prefecture.
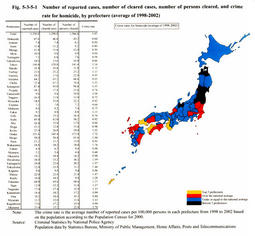
(1) Trends over the last 5 years in the number of reported cases, number of cleared cases, number of persons cleared, and crime rate for heinous offenses (a) Homicide Fig. 5-3-5-1 shows the average values over the 5 years from 1998 to 2002 by prefecture, with respect to the number of reported cases, number of cleared cases, number of persons cleared, and crime rate (average number of reported cases per 100,000 persons in each prefecture) for homicide. The number of reported cases was remarkably large in Tokyo and Osaka with 140.4 cases and 151.6 cases respectively, followed by Kanagawa, Chiba, Fukuoka, Aichi, Saitama, and Hyogo with 50-80 cases each. The number of reported cases was also large in other prefectures with large populations. The same trend was seen with respect to the number of cleared cases and the number of persons cleared. The national average crime rate was 1.07 whereas the highest rate was 1.78 and the lowest 0.50. There were no significant gaps among prefectures and high and low rates were dispersed throughout Japan, with some concentrations of slightly high rates in the Western area and slightly low rates in the Northeast area and the Hokuriku area.
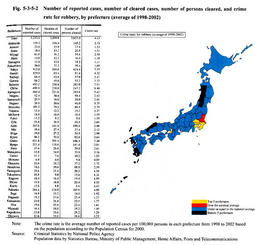
Fig. 5-3-5-1 Number of reported cases, number of cleared cases, number of persons cleared, and crime rate for homicide, by prefecture (average of 1998-2002) (b) Robbery Fig. 5-3-5-2 shows the average values over the 5 years from 1998 to 2002 by prefecture, with respect to the number of reported cases, number of cleared cases, number of persons cleared, and crime rate for robbery. The number of reported cases was strikingly large in Tokyo with 913.0 cases, followed by Osaka with 651.8 cases, Chiba, Saitama, and Kanagawa with over 400 cases, Aichi, Hyogo, and Fukuoka with over 200 cases, and Hokkaido, Ibaraki, and Shizuoka with over 100 cases. The number of reported cases was also large in other prefectures with a large population or prefectures located near the Tokyo Metropolitan Area. Compared with homicide, the occurrence of robbery cases was noticeably concentrated in Tokyo, Tokyo Metropolitan Area and Osaka. The same trend was seen with respect to the number of cleared cases and the number of persons cleared. The national average crime rate was 4.13 whereas the highest rate was 8.40 and the lowest 0.89. There was a greater gap among prefectures compared with the crime rate for homicide. Only Tokyo and its 4 surrounding prefectures and Osaka had crime rates that exceeded the national average rate, and crime rates of other prefectures were lower than the national average rate. Thus, the crime rate distribution was uneven.
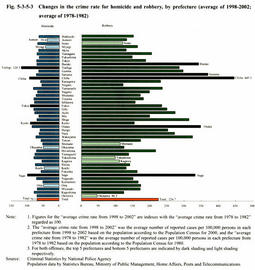
Fig. 5-3-5-2 Number of reported cases, number of cleared cases, number of persons cleared, and crime rate for robbery, by prefecture (average of 1998-2002) (2) Regional changes over the 20 years in the crime rate for heinous offenses Fig. 5-3-5-3 shows the "average crime rate over the 5 years from 1998 to 2002" for homicide and robbery, which are indicated by regarding the "average crime rate over the 5 years from 1978 to 1982" for these heinous offenses as 100. As for homicide, the crime rate generally declined in these 20 years, with the national average rate coming to 70.1, the highest rate to 120.3, and the lowest rate to 39.4. Thus, there is not a significant gap among prefectures or pattern in the increase/decrease in the crime rate. As for robbery, on the other hand, the crime rate generally surged in these 20 years, and there is a significant gap among prefectures in the increase/decrease in the crime rate, with the national average rate coming to 224.7, the highest rate to 445.1, and the lowest to 46.3. The crime rate was high in prefectures where there was rapid increase in population as "bed towns" (bed towns are residential areas close to large city centers so called because they are used exclusively as sleeping quarters for workers commuting to those centers) of large cities around Tokyo, such as Chiba, Saitama, Ibaraki, Tochigi, and Gunma, and prefectures in the Kansai Metropolitan Area including Osaka, Wakayama, and Shiga. In particular, with respect to the Tokyo metropolitan area, the increase of the crime rate in Tokyo was below the national average whereas the crime rate in the 7 other prefectures of the Kanto Region-Kanagawa, Chiba, Saitama, Ibaraki, Tochigi, Gunma, and Yamanashi-increased sharply over the last 20 years, exceeding the rate in Tokyo and the national average rate. Thus, the decrease in the crime rate in Tokyo and the increase in the prefectures around it are giving rise to what could be called a "doughnut phenomenon".
Fig. 5-3-5-3 Changes in the crime rate for homicide and robbery, by prefecture (average of 1998-2002; average of 1978-1982) (3) Factors behind regional changes As the crime rate for each prefecture shown above is calculated per 100,000 persons, the rapid rise in the crime rate for robbery seen in the prefectures around Tokyo and Osaka is not merely due to the population increase in these prefectures, but the crime rate has been increasing far more rapidly than the population increase. It is not easy to identify factors behind such rapid rise in the crime rate because the increase in the number of offenses arises from a complex combination of social factors. Nevertheless, a common factor for the sharp rise in the crime rate among these prefectures seems to be the rapid increase in the population along with the rapid development of these prefectures as bed towns, which may be closely related to the sharp rise in the increase of the crime rate. Along with the progress in the development as bed towns, conventional communities in these prefectures change accordingly, and as more residents go to work or school in urban areas and become less oriented toward or less conscious of their own communities, robbery is committed more frequently targeting such vacancies in communities (there may be a close relationship between the increase in the crime rate and the population increase, and between the crime rate and the rate of people who go to work or school in other cities). Furthermore, the factors behind the increase in the number of street robbery cases may be: (1) the expansion and increase of entertainment districts as well as convenience stores and other overnight stores to suburban cities around the Tokyo metropolitan area; (ii) the increase in people who come from work or school to suburban cities in the nighttime; and (iii) the increase in persons, and in particular juveniles, out of employment due to job losses. On the other hand, the factors behind the increase in invasive robbery cases may be as follows: with respect to robbery targeting stores/offices, (i) the same as (i) above; with respect to robbery targeting houses, (ii) the decline in crime prevention due to the increase in small families or nuclear families; and with respect to robbery targeting houses and stores/offices, (iii) the increase in the number of unemployed persons due to job losses and (iv) the development in transportation means including road networks in large cities, through which offenders can easily hide or escape, as well as the fact that it is become easier to commit robbery while traveling in cars across wide areas.
|