| Previous Next Index Image Index Year Selection | |
|
|
3 Characteristics of juveniles on probationary supervision The characteristics of juveniles on probationary supervision are considered in light of the number of juvenile probationers (excluding juveniles under short-term probation for traffic offenses; hereinafter the same in this section) and juvenile parolees, who were newly received by probation offices in 2002.
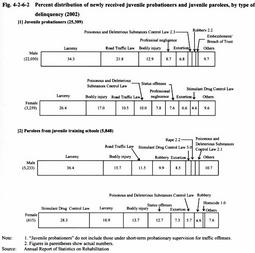
(1) By gender and type of delinquency Fig. 4-2-6-2 shows types of delinquency by gender.
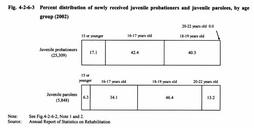
3,259 (12.9%) out of 25,309 juvenile probationers in total were females, and 615 (10.5%) out of 5,848 juvenile parolees in total were females. By type of delinquency, for juvenile probationers larceny was most frequent for both males and females (34.3% for males and 26.4% for females), followed by Road Traffic Law violation and bodily injury for males and by bodily injury, Road Traffic Law violation, and Poisonous and Deleterious Substances Control Law violation for females in that order. As for juvenile parolees, larceny (36.4%) had the largest share for males, followed by bodily injury and Road Traffic Law violation, showing a similar tendency to juvenile probationers but one that differed in that robbery followed these offenses. For females, Stimulant Drug Control Law violation (28.3%) accounted for the most, followed by larceny, bodily injury, status offense, showing large difference from both juvenile probationers and male juvenile parolees. Fig. 4-2-6-2 Percent distribution of newly received juvenile probationers and juvenile parolees, by type of delinquency (2002) (2) Age group Fig. 4-2-6-3 shows age groups. As for juvenile probationers, 16-17 year olds and 18-19 year olds had the almost same share, slightly exceeding 40%, and that of 15 year olds or younger was less than 20%. For juvenile parolees, 18-19 year olds had the largest share with 46.4%, and the percentage of 16-17 year olds was 34.1 %. The percentage of 20 years and older also reached 13.2%. Juvenile parolees are in higher age groups than juvenile probationers as a whole.
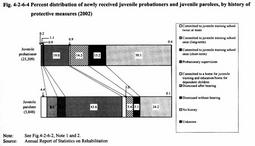
Fig. 4-2-6-3 Percent distribution of newly received juvenile probationers and juvenile parolees, by age group (2002) (3) History of protective measures Fig. 4-2-6-4 shows the history of protective measures. For juvenile probationers, those without a history of protective measures had a majority at 50.1% (down 0.1 point from the previous year), followed by those with a history of protective measures at 19.0%, those who had been dismissed after hearing by family court at 14.2%, and those who had been dismissed without hearing by family court at 13.2%. In contrast, for juvenile parolees, those without a history of protective measures accounted for only 24.2% (down 1.6 points from the previous year), and even for those with a history of protective measures, those who had been dismissed after hearing (5.4%) and those who had been dismissed without hearing (5.1 %) had a small share, and former juvenile probationers had the largest share at 43.6%. The percentage of those who had been committed to juvenile training schools (total of those committed once and twice or more) also reached 18.5%.
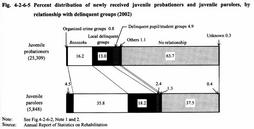
Fig. 4-2-6-4 Percent distribution of newly received juvenile probationers and juvenile parolees, by history of protective measures (2002) (4) Relationship with delinquent groups Fig. 4-2-6-5 shows relationships with delinquent groups. Over 60% of juvenile probationers had no relationships with delinquent groups. A total of 16.2% had relationships with bosozoku, 13.0% with local delinquent groups , and 4.9% with delinquent pupil/student groups. For juvenile parolees, those who had no relationships with delinquent groups accounted for less than 40%, and the percentages of those who had relationships with bosozoku (35.8%) and those who had relationships with local delinquent groups (18.2%) were high. Also, 4.5% had relationships with organized crime groups, and more than 60% of juvenile probationers had relationships with delinquent groups.
Fig. 4-2-6-5 Percent distribution of newly received juvenile probationers and juvenile parolees, by relationship with delinquent groups (2002) (6) History of drug abuse Viewing the history of drug abuse, 87.6% of juvenile probationers had no history of drug abuse, 10.1% had used thinners or other organic solvents, 1.3% had used stimulant drugs, and 0.8% had used cannabis or other drugs. Not many juvenile probationers had a history of drug abuse. As regards juvenile parolees, 66.4% had no history of drug abuse, 22.8% had used thinners or other organic solvents, 9.2% had used stimulant drugs, and 1.3% had used cannabis or other drugs. The percentage of those who had a history of drug abuse is higher among juvenile parolees than juvenile probationers (Source: Annual Report of Statistics on Rehabilitation).
|