| Previous Next Index Image Index Year Selection | |
|
|
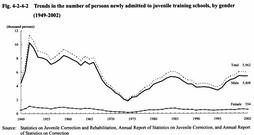
2 Admission and discharge (1) Admission Fig. 4-2-4-2 shows the trends in the number of persons newly admitted to juvenile training schools since 1949. In 2002, 5,962 juveniles were newly admitted (down 0.8% from the previous year). The average daily number of inmates admitted stood at 4,794 (down 0.3%) (see Appendix 4-11 ). Both numbers decreased slightly from the previous year. Assuming the number of persons newly admitted to juvenile training schools in 1995 as 100 for index purposes, 156 is applied to 2002 (161 for males, and 117 for females), indicating that the level continues to be high.
Fig. 4-2-4-2 Trends in the number of persons newly admitted to juvenile training schools, by gender (1949-2002) Table 4-2-4-3 shows the number of juveniles newly admitted in 2002 by type of juvenile training school and treatment. Viewing the percent distribution by type of juvenile training school, juveniles newly admitted to middle juvenile training schools constituted a majority, accounting for 84.2%. Those newly admitted to primary juvenile training schools accounted for 11.3%, those to advanced juvenile training schools accounted for 2.1%, and those to medical juvenile training schools accounted for 2.5%. Compared with the pervious year, the number for middle juvenile training schools increased slightly while the numbers for other types decreased. By type of treatment, juveniles subject to long-term treatment accounted for more than 60%. However, compared to the previous year, the number of such juveniles decreased while the number of juveniles subject to short-term treatment increased.Table 4-2-4-3 Number of persons newly admitted in juvenile training schools, by type of school and treatment (2002) In 2002, no convicted juvenile was imprisoned in juvenile training schools (Source: Annual Report of Statistics on Correction).(2) Discharge In 2002, 6,043 inmates were discharged from juvenile training schools, 5,848 (96.8%) of which were released on parole. Of those discharged, 31.9% found jobs, 48.6% were seeking employment, 11.2% wished to enter schools at higher levels, 2.0% returned to junior high school and 2.3% returned to senior high school. Only 2.9% were discharged with no prospects for subsequent education or employment. The percentage of those who found jobs or returned to schools among those discharged was 36.2%, showing an increase of 0.2 points from the previous year (Source: Annual Report of Statistics on Correction).
The average detention period of those released on parole was 381 days for long-term treatment, 150 days for general short-term treatment, and 81 days for special short-term treatment (Source: Annual Report of Statistics on Correction). |

