| Previous Next Index Image Index Year Selection | |
|
|
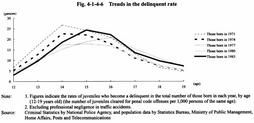
6 Trends in the delinquent rate Fig. 4-1-4-6 shows how the rate of delinquents (see Note 1 in the figure) for juveniles born in the same year changes in accordance with the growth of the juveniles in question thereafter, by generation. Regarding juveniles born in 1971, 1974, 1977, 1980, and 1983, the age is shown on the horizontal axis while the delinquent rate is shown on the vertical axis. The delinquent rate was highest at the age of 14 for juveniles born in 1971 and 1974, at the age of 15 for those born in 1977 and 1983, and at the age of 16 for those born in 1980. The rate was generally highest at the age of 14-16 and declined as juveniles got older (17, 18, and 19 years old) for all generations.
Fig. 4-1-4-6 Trends in the delinquent rate |