| Previous Next Index Image Index Year Selection | |
|
|
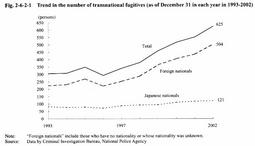
1 Transnational fugitives from Japan Fig. 2-6-2-1 shows the trend in the number of suspects who committed offenses in Japan and escaped abroad over the last 10 years. The number of transnational fugitives increased since 1997 and it reached 625 (up by 13.0% from December 31, 2001) as of December 31, 2002.
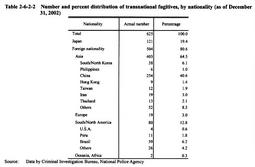
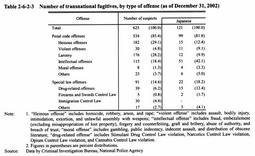
Fig. 2-6-2-1 Trend in the number of transnational fugitives (as of December 31 in each year in 1993-2002) Table 2-6-2-2 shows the trend by nationality (including regions). Most transnational fugitives, 254 (40.6% of the total), were Chinese, followed by Japanese with 121 (19.4%), Brazilian with 39 (6.2%), and South/North Korean with 38 (6.1%).Table 2-6-2-2 Number and percent distribution of transnational fugitives, by nationality (as of December 31, 2002) Table 2-6-2-3 shows the number of transnational fugitives as of December 31, 2002, by type of offense. Most of them, 182 suspects, committed heinous offenses, followed by larceny, intellectual offenses, and drug-related offenses.Table 2-6-2-3 Number of transnational fugitives, by type of offense (as of December 31, 2002) If examined countries (including regions) to which transnational fugitives seem to have escaped as of December 31, 2002, 122 suspects (including 8 Japanese) seem to have escaped to China with the largest share, followed by the Philippines with 36 (including 26 Japanese), South/North Korea with 25 (including 4 Japanese), and the United States with 13 (including 11 Japanese) (Source: Data by Criminal Investigation Bureau, National Police Agency). |


