| Previous Next Index Image Index Year Selection | |
|
|
2 State of probationary supervision In this subsection, we will give an overview of the trends in probation cases, focusing on adult parolees and probationers (for juvenile probationers and parolees, see Part 4, Chapter 2, Section 6-2 .)
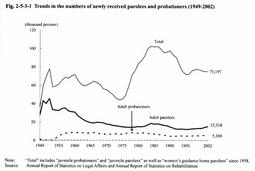
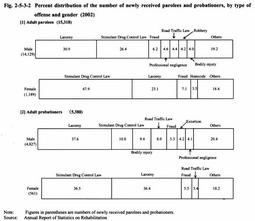
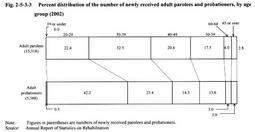
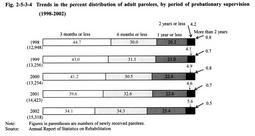
Fig. 2-5-3-1 shows the trends in the total numbers of parolees and probationers newly received by probation offices as well as the number of adult parolees and probationers (see Appendix 2-13 ). Fig. 2-5-3-1 Trends in the numbers of newly received parolees and probationers (1949-2002) The number of adult probationers was within the range of 7,000 or over but below 9,000 between 1975 and 1984, but it has been within the range of between 4,000 and 6,000 since 1989. It was 5,388 in 2002. In recent years, probation offices have received no parolees from women's guidance homes. Fig. 2-5-3-2 shows the percent distribution of the number of parolees and probationers newly received in 2002, by type of offense and gender. The percentages of adult parolees and probationers who committed larceny and Stimulant Drug Control Law violations were high. In particular, the percentage of Stimulant Drug Control Law violations exceeded that of larceny for female parolees and probationers. Fig. 2-5-3-2 Percent distribution of the number of newly received parolees and probationers, by type of offense and gender (2002) Fig. 2-5-3-4 shows the trend in the percent distribution of the number of adult parolees newly received over the last 5 years, by period of probationary supervision. While the percentage of parolees placed on parole supervision for "3 months or less" shows a decreasing trend, the percentage of those for "1 year or less" is on an increasing trend. Fig. 2-5-3-3 Percent distribution of the number of newly received adult parolees and probationers, by age group (2002) Fig. 2-5-3-4 Trends in the percent distribution of adult parolees, by period of probationary supervision (1998-2002) |