| Previous Next Index Image Index Year Selection | |
|
|
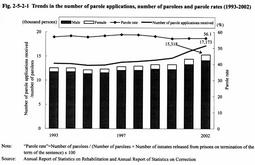
2 Administration of parole Fig. 2-5-2-1 shows the trends in the number of inmates whose parole applications were received, the number of parolees and the parole rates since 1993 (see Appendix 2-12 ).
(1) Number of parole applications received The number of parole applications received was 13,249 in 1992, marking a figure below 13,500 for the first time after the war, and it remained below 14,000 since then until 1998. However, it was 14,179 in 1999 and has continued to increase every year, reaching 17,173 in 2002. In recent years, almost no applications have been received for provisional release of penal detainees or workhouse detainees, or provisional discharge of women in women's guidance homes, but 1 detainee was granted provisional release in 2000 and 2002.
Fig. 2-5-2-1 Trends in the number of parole applications, number of parolees and parole rates (1993-2002) (2) Number of parolees and parole rate The number of parolees shows a similar trend to the number of parole applications received. It was 12,417 in 1992, breaking through 13,000 for the first time after the war, and remained below 13,000 until 1998, but it was 13,000 or over but below 14,000 in 1999 and 2000 and increased to 14,423 in 2001 and 15,318 in 2002. The parole rate was 50.8% in 1982, its lowest level after the war, but it rose to 53.7% in 1983 and has remained within the range of 55 % or over but below 59% since 1984. It was the same as the previous year at 56.1 % in 2002.
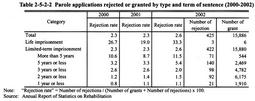
(3) Rate of rejection of parole applications Table 2-5-2-2 shows the rates of rejection of parole applications over the last 3 years by type of sentence etc. The rates of rejection are relatively high for life imprisonment with 33.3% and imprisonment for more than 5 years with 11.5% in 2002.
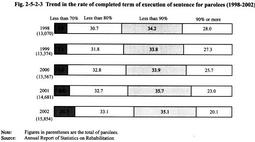
Table 2-5-2-2 Parole applications rejected or granted by type and term of sentence (2000-2002) (4) Rate of completed term of execution of sentence for parolees Fig. 2-5-2-3 shows the rates of completed term of the execution of the sentence (percentage of the term actually served until release on parole) for inmates granted parole in each year over the last 5 years (excluding inmates serving an indeterminate or life imprisonment sentence). While the percentage of inmates who have served 90% or more of the original sentence decreased, the percentages of inmates who have served less than 70% or less than 80% are on an increasing trend.
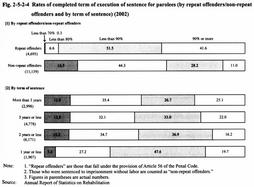
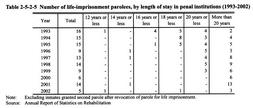
Fig. 2-5-2-4 shows the rates of completed term of the execution of the sentence for inmates granted parole in 2002, by repeat offender/non-repeat offender and by term of sentence. In the comparison between repeat offenders and non-repeat offenders, the rate of completed term is lower for the latter. By term of sentence, for inmates sentenced to imprisonment for 1 year or less, those served 80% or more but less than 90% of the original sentence accounted for about 50%. By adding those served 90% or more of the original sentence, the rate accounted for about 70%. The rate of completed term is higher for inmates of imprisonment for 1 year or less than for inmates of other terms. Table 2-5-2-5 shows the number of inmates serving a life imprisonment sentence who were granted parole over the last 10 years, by length of stay in penal institutions. Fig. 2-5-2-3 Trend in the rate of completed term of execution of sentence for parolees (1998-2002) Fig. 2-5-2-4 Rates of completed term of execution of sentence for parolees (by repeat offenders/non-repeat offenders and by term of sentence) (2002) Table 2-5-2-5 Number of life-imprisonment parolees, by length of stay in penal institutions (1993-2002) (5) Environmental adjustment of next abode after release In order to help offenders in penal institutions and juvenile training schools make a smooth return to society, probation offices carry out environmental adjustment. This involves continuously coordinating with family members and other guarantors as soon as the offenders are imprisoned in the institutions/schools, and preparing the environment the most conducive for the offender's return to society.
In 2002, environmental adjustment was newly carried out for a total of 51,244 offenders, consisting of 43,997 prisoners and 7,247 juvenile training school inmates. As of December 31, 2002, environmental adjustment was being carried out for a total of 56,308 offenders (prisoners and juvenile training school inmates) (Source: Annual Report of Statistics on Rehabilitation). |