| Previous Next Index Image Index Year Selection | |
|
|
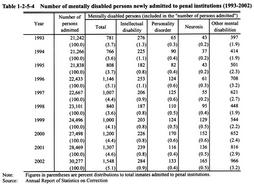
3 The mentally disabled in correctional institutions Table 1-2-5-4 shows the trends in the number of mentally disabled inmates newly admitted to penal institutions during the period from 1993 to 2002.
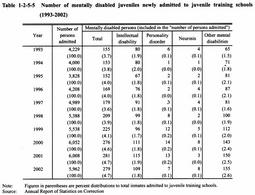
Table 1-2-5-5 shows the trends in the number of mentally disabled juveniles newly admitted to juvenile training schools during the period from 1993 to 2002. Those who need special treatment are admitted to medical prisons or medical juvenile training schools and receive necessary treatment. Table 1-2-5-4 Number of mentally disabled persons newly admitted to penal institutions (1993-2002) Table 1-2-5-5 Number of mentally disabled juveniles newly admitted to juvenile training schools (1993-2002) |

