| Previous Next Index Image Index Year Selection | |
|
|
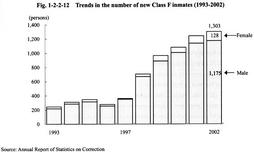
5 Correction and rehabilitation of foreign offenders (1) Correction In 2002, the number of foreign nationals newly imprisoned was 1,967, an increase by 105 (5.6%) from the previous year (Source: Annual Report of Statistics on Correction). Foreign nationals who need treatment programs different from those for Japanese inmates are categorized as Class F and treated accordingly. Fig. 1-2-2-12 shows the trends in the number of new Class F inmates over the last 10 years. The Class F inmates have increased rapidly since 1998, reaching 1,303 in 2002, more than 5 times larger than the number in 1993 (245 inmates).
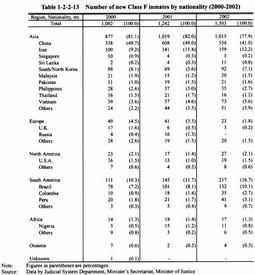
Table 1-2-2-13 shows the number of new Class F inmates over the last 3 years by nationality. During this period, those from China have been the largest, followed by those from Iran. The inmates from Brazil have increased rapidly from 78 in 2000 to 101 in 2001 and 132 in 2002, surpassing those from South/North Korea since 2001 to come in third. Attention should be paid to the trend of them (Source: Data by Judicial System Department, Minister's Secretariat, Minister of Justice). Among new Class F inmates in 2002, by offense, those imprisoned for larceny were the largest with 446 persons (34.2%), followed by Immigration Control Law violations with 203 persons (15.6%), Stimulant Drug Control Law violations with 178 persons (13.7%), robbery with 165 persons (12.7%), breaking and entering with 36 persons (2.8%), Narcotics Control Law violations with 29 persons (2.2%), and homicide with 27 persons (2.1 %) As of December 31, 2002, the number of Class F inmates was 2,638 (2,453 males and 185 females), increasing 323 persons (14.0%) over the previous year (Source: Annual Report of Statistics on Correction). Fig. 1-2-2-12 Trends in the number of new Class F inmates (1993-2002) Table 1-2-2-13 Number of new Class F inmates by nationality (2000-2002) (2) Rehabilitation The number of foreign probationers and parolees newly received in 2002 was 1,203, almost the same as the previous year (1,217). By type of probation/parole, adult parolees were the largest (922 persons), followed by juvenile probationers (186 persons), juvenile parolees (64 persons), and adult probationers (31 persons) (Source: Annual Report of Statistics on Rehabilitation).
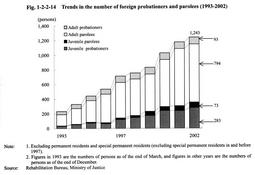
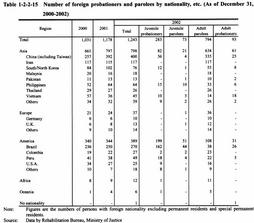
Fig. 1-2-2-14 shows the trends in the number of foreign probationers and parolees (excluding permanent residents and special permanent residents) over the last 10 years. Foreign probationers/parolees have increased consistently, up 65 persons (5.5%) from the previous year to 1,243 in 2002. Fig. 1-2-2-14 Trends in the number of foreign probationers and parolees (1993-2002) Table 1-2-2-15 Number of foreign probationers and parolees by nationality, etc. (As of December 31, 2000-2002) |