Previous     Next            Index     Image Index     Year Selection
 White paper on crime 2003 Part 1/Chap.2/Sec.1/2 

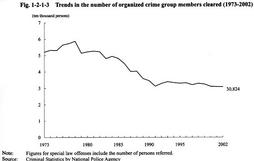
2 Trends in offenses by organized crime groups

   Fig. 1-2-1-3 shows the trends in the number of organized crime group members cleared for offenses other than professional negligence in traffic accidents and violations of traffic-related laws since 1973. The members cleared were within the 30,000-40,000 range, decreasing by 93 from the previous year to 30,824 in 2002. Among them, 9,907 persons were regular members of groups, up 14 from the previous year.

Fig. 1-2-1-3 Trends in the number of organized crime group members cleared (1973-2002)

   Table 1-2-1-4 shows the number of organized crime group members included in the total number of persons cleared for penal code offenses and special law offenses in 2002, by type of major offense. Among organized crime group members cleared in 2002, 20,405 (up 755 from the previous year) were for penal code offenses, and 10,419 (down 848 from the previous year) were for special law offenses. Among the offenses of organized crime group members cleared, Stimulant Drug Control Law violation was the highest at 21.7% (6,699 persons), followed by bodily injury at 15.9% (4,904 persons), extortion at 9.6% (2,954 persons), and larceny at 9.5% (2,917 persons) (Source: Criminal Statistics by National Police Agency).

Table 1-2-1-4 Number of organized crime group members in the number of persons cleared, by type of major offense (2002)