| Previous Next Index Image Index Year Selection | |
|
|
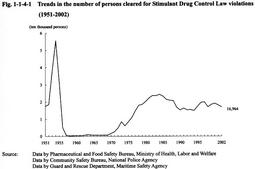
1 Trends in drug offenses (1) Stimulant Drug Control Law violations Fig. 1-1-4-1 shows the number of persons cleared for Stimulant Drug Control Law violations from 1951 to 2002. Drug abuse began to become widespread during the chaotic postwar period, and experienced 2 boom periods until now. The number of persons cleared fell sharply after peaking at 55,664 in 1954. As for the reasons behind this trend, it was pointed out that penal regulations were strengthened in 1954 and 1955, that clearance by police was implemented thoroughly, and that educational campaigns concerning the harmful influence of stimulant drugs were held nationally. However, the number of persons cleared took an upward turn again in 1970 and reached 24,372 in 1984, entering the second boom period. From then, it hovered within the 20,000-30,000 range until 1988, but fell below 20,000 in 1989 and decreased to 14,896 in 1994. However, it started to increase again in 1995 and nearly reached 20,000 in 1997, when it entered the third boom period. In 2002, however, the number of persons cleared decreased by 1,146 (6.3%) from the previous year to 16,964.
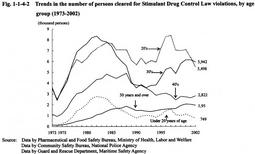
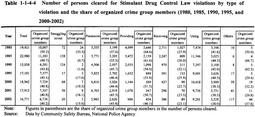
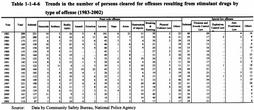
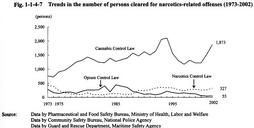
Fig. 1-1-4-1 Trends in the number of persons cleared for Stimulant Drug Control Law violations (1951-2002) Fig. 1-1-4-2 Trends in the number of persons cleared for Stimulant Drug Control Law violations, by age group (1973-2002) The number and share of those who violated the law for profits has decreased every year from 1,549 (7.8%) in 1980 to 437 (2.6%) in 2002. By type of violation, among those who violated the law for profits in 2002, 292 (4.9%) were cleared for possessing and 133 (9.7%) for providing or receiving drugs. Table 1-1-4-3 Trends in the number of persons cleared for Stimulant Drug Control Law violations by type of violation and the share of those who violated the law for profits (1980, 1985, 1990, 1995, and 2000-2002) Table 1-1-4-4 Number of persons cleared for Stimulant Drug Control Law violations by type of violation and the share of organized crime group members (1980, 1985, 1990, 1995, and 2000-2002) Table 1-1-4-5 Number of foreign nationals (including foreign residents in Japan) cleared for Stimulant Drug Control Law violations by type of violation and nationality, etc. (2002) Table 1-1-4-6 Trends in the number of persons cleared for offenses resulting from stimulant drugs by type of offense (1983-2002) (2) Narcotics-related offenses Fig. 1-1-4-7 shows the trends in the number of persons cleared for narcotics-related offenses (violations of the Narcotics Control Law, Opium Control Law, and Cannabis Control Law; hereinafter the same in this section) over the 30 years since 1973.
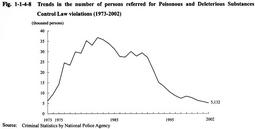
The number of persons cleared for Cannabis Control Law violations rose overall for a long term, despite repeated increases and decreases, and reached 2,103 in 1994. It then fell sharply but started to rise again in 2001, reaching 1,873 in 2002, causing concern over the recent upward trend. Fig. 1-1-4-7 Trends in the number of persons cleared for narcotics-related offenses (1973-2002) (3) Poisonous and Deleterious Substances Control Law violations Fig. 1-1-4-8 shows the trends in the number of persons referred for Poisonous and Deleterious Substances Control Law violations since 1973. The number of persons referred was within the 30,000-40,00 range since 1980 and peaked at 36,796 in 1982. The number then decreased gradually and fell to 5,132 in 2002, about 1/7th of the number at the peak.
Fig. 1-1-4-8 Trends in the number of persons referred for Poisonous and Deleterious Substances Control Law violations (1973-2002) |