| Previous Next Index Image Index Year Selection | |
|
|
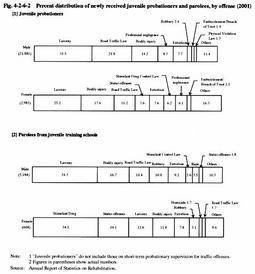
3 Characteristics of Juveniles on probationary supervision (1) Type of offense Fig. 4-2-6-2 shows the percent distribution of juvenile probationers (excluding those on short-term probation for traffic offenses; hereinafter the same in this subsection) and parolees from juvenile training schools newly received by probation offices in 2001, by offense. The percent distribution of larceny for male juvenile probationers and parolees from juvenile training schools had the largest share of all. On the other hand, the percent distribution of larceny for female juvenile probationers had the largest share, followed by bodily injury. The percent distribution of violations of the Stimulant Drug Control Law for parolees from juvenile training schools had the highest share, followed by status offense.
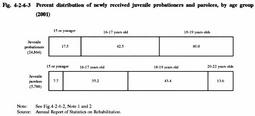
(2) Age Fig. 4-2-6-3 shows the number of newly received juvenile probationers and parolees in 2000, by age group. As for juvenile probationers, 16-17 year olds had the largest share, which was almost the same as that of 18-19 year olds. Also, the percentage of those who are 15 or younger shows an upward trend, and is 17.5% in 2001, an increase of 0.7 points from the previous year. Although 18-19 year olds also had the largest share in parolees from juvenile training schools, the percentage of those parolees who were 20 years and older increased to 13.6%.
Fig. 4-2-6-2 Percent distribution of newly received juvenile probationers and parolees, by offense (2001) Fig. 4-2-6-3 Percent distribution of newly received juvenile probationers and parolees, by age group (2001) (3) Nationality Examining the percent distribution of newly received juvenile probationers and parolees by nationality (including regions) in 2001, Japanese formed the highest share in juvenile probationers newly received with 98.1%, followed by Koreans with 0.8%, Brazilians with 0.6%, and Chinese with 0.2%. As regards juvenile parolees, Japanese also formed the largest share by far with 97.9%, followed by Koreans with 1.2%, Brazilians with 0.5%, Philippine nationals, Peruvians, Chinese, and Vietnamese with 0.1% each (Source: Annual Report of Statistics on Rehabilitation).
(4) Previous record of protective measures Examining newly received juvenile probationers and parolees by previous record of protective measures in 2001, the percentage of juveniles with no previous record was highest among juvenile probationers newly received, at 50.2% (up 0.8 point from the previous year. This was followed by those on probation, at 18.4%, those who had been dismissed after a hearing, at 14.7%, and those who had been dismissed without a hearing, at 13.1%. Among juvenile parolees, those without any previous record only accounted for 25.8% (up 0.2 point from the previous year). As regards parolees with previous records, former juvenile probationers had the largest share, at 40.3%, followed by those who had been committed to juvenile training schools, at 17.3%, those who had been dismissed after a hearing, at 6.3%, and those who had been dismissed without a hearing, at 5.9%. (Source: Annual Report of Statistics on Rehabilitation).
(5) Drug abuse Among juvenile probationers newly received, 14.2% were using drugs at the time of reception in 2001. By type of drug, organic solvents were used most frequently (11.6%), followed by stimulant drug, at 1.8%. As regards juvenile parolees, 36.6% (2.9 points down from the previous year) were using drugs the time of reception. By type of drug, organic solvents (23.8%) and stimulant drugs (11.5%) were used most commonly (Source: Annual Report of Statistics on Rehabilitation).
(6) Relationship with delinquent groups 38.0% of juvenile probationers newly received in 2001 had relationships with delinquent groups at the time of reception. Bosozoku were the most frequent group of association (17.5%), followed by local delinquent groups (13.3%), delinquent pupil/student groups (5.3%), and organized crime groups (0.7%). The percentage was as high as 62.9% for juvenile parolees, with frequent association with bosozoku (35.2%), local delinquent groups (18.8%) and organized crime groups (4.5%), in that order. Therefore, the percentage of the relationship with organized crime groups in particular was far higher than the cases of juvenile probationers (Source: Annual Report of Statistics on Rehabilitation).
|