| Previous Next Index Image Index Year Selection | |
|
|
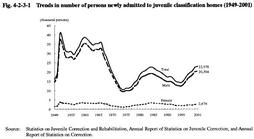
2 Admission and discharge Fig. 4-2-3-1 shows the trends in the number of persons newly admitted to juvenile classification homes since 1949.
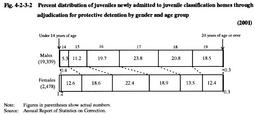
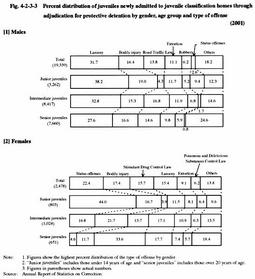
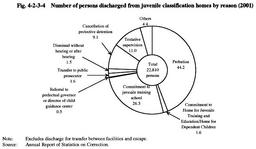
Fig. 4-2-3-1 Trends in number of persons newly admitted to juvenile classification homes (1949-2001) Fig. 4-2-3-2 shows the percent distribution of each type of delinquency in juveniles newly admitted through adjudication for protective detention in 2001, by gender and age group. Females are more likely to be admitted at a younger age compared to males. Fig. 4-2-3-3 also shows the percent distribution of each type of delinquency in juveniles newly admitted through adjudication for protective detention in 2001, by gender. The distribution of larceny is highest for delinquent males in every age group, followed by bodily injury, extortion and status offenses for junior juveniles, Road Traffic Law violations, bodily injury and extortion for intermediate juveniles, and bodily injury, Road Traffic Law violations and extortion for senior juveniles. As regards delinquent females, status offenses had the greatest share for junior juveniles (over 40%). However, the percent distribution of status offenses committed is smaller for older age groups. For intermediate juveniles, the percent distribution of bodily injury had the greatest share, followed by larceny and status offenses. As for senior juveniles, the percentage of Stimulant Drug Control Law violations was highest. Regarding the Stimulant Drug Control Law violations, as opposed to the status offenses, as juveniles get older, the percent distribution of such violations increases remarkably. Fig. 4-2-3-2 Percent distribution of juveniles newly admitted to juvenile classification homes through adjudication for protective detention by gender and age group (2001) Fig. 4-2-3-3 Percent distribution of juveniles newly admitted to juvenile classification homes through adjudication for protective detention by gender, age group and type of offense (2001) Fig. 4-2-3-4 Number of persons discharged from juvenile classification homes by reason (2001) |