| Previous Next Index Image Index Year Selection | |
|
|
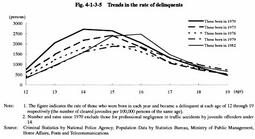
6 Trends in the delinquent rate Fig. 4-1-3-5 indicates how the rate of delinquents by generation for juveniles born in the same year changes in accordance with the growth of the juveniles in question thereafter. The ages from 12 to 19 for the juveniles who were born in 1970, 1973, 1976, 1979, and 1982 are shown on the horizontal axis. And the delinquent rate is shown on the vertical axis. The delinquent rate is approximately at its highest at the ages from 14 to 16 for each year group. And the higher the age gets, i.e., at 17, 18, and 19, the lower the rate becomes. Also, examining the age where the delinquent rate is highest, it is clear that it is highest at the age of 14 for those born in 1970, at the age of 15 for those born in 1973, and 1976, at the age of 15 through 16 for those born in 1979, and at the age of 16 for those born in 1982. This shows that the delinquent rate is higher for those who were born later.
Fig. 4-1-3-5 Trends in the rate of delinquents |