| Previous Next Index Image Index Year Selection | |
|
|
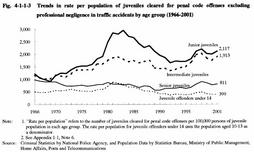
2 Trends by age group and gender Fig. 4-1-1-3 shows the trends in the number of juveniles cleared for penal code offenses excluding professional negligence in traffic accidents by age group since 1966 (see Appendix 4-2 ).
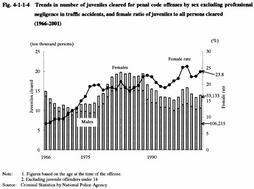
Fig. 4-1-1-3 Trends in rate per population of juveniles cleared for penal code offenses excluding professional negligence in traffic accidents by age group (1966-2001) Fig. 4-1-1-4 shows the trends in female rate. The female rate has generally showed an upward trend since 1993. It decreased once in 1999 but rose again in 2001, from 22.4% to 23.8%. Fig. 4-1-1-4 Trends in number of juveniles cleared for penal code offenses by sex excluding professional negligence in traffic accidents, and female ratio of juveniles to all persons cleared (1966-2001) |