| Previous Next Index Image Index Year Selection | |
|
|
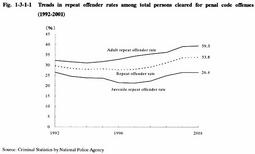
Fig. 1-3-1-1 shows the trends in the rate of repeat offenders among the total number of adult and juvenile offenders cleared for penal code offenses excluding professional negligence in traffic accidents (hereinafter referred to as "repeat offender rate") over the last decade. (See the next section for details of trends concerning juvenile offenders ).
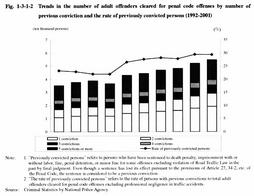
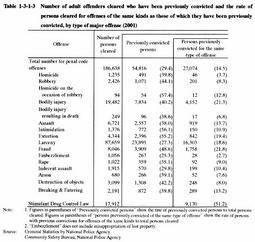
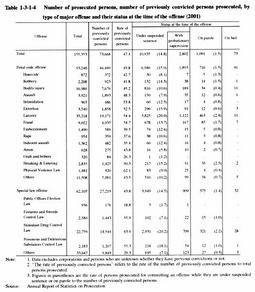
Fig. 1-3-1-1 Trends in repeat offender rates among total persons cleared for penal code offenses (1992-2001) Fig. 1-3-1-2 Trends in the number of adult offenders cleared for penal code offenses by number of previous conviction and the rate of previously convicted persons (1992-2001) In the case of adult offenders, repeat offender rate has been on the rise since 1995, and the rate of persons cleared who have been previously convicted (hereinafter referred to as "previously convicted persons") has also been generally rising since 1996. Viewing the previously convicted persons cleared, by the number of previous convictions, it has been generally increasing through all periods from 1992 to 2001 regardless of the number of previous convictions, and in particular, persons with 1 prior conviction has risen sharply. Table 1-3-1-3 shows the rate of persons cleared for offenses of the same kinds as those of which they had been previously convicted. As for all penal code offenses excluding professional negligence in traffic accidents, the persons cleared who had been previously convicted of the same offenses accounted for 14.5% of all persons cleared in 2001. By type of major offense, fraud (21.8%) showed the highest percentage, followed by bodily injury (21.3%). As for special law offenses, Stimulant Drug Control Law violations, showed 51.2% (according to Criminal Statistics by National Police Agency). Table 1-3-1-4 shows the number of all the persons prosecuted in 2001 and the number of previously convicted persons among them and their status at the time of the offense (under suspended sentences, on parole or on bail) by type of major offense. Among penal code offenses, the rate of previously convicted persons to the total persons prosecuted for Physical Violence Law violations was the highest, followed by fraud and larceny, both of which were committed for the purpose of obtaining property. The rate of previously convicted persons to the total persons prosecuted for special law offenses was lower than that for penal code offenses as a whole. However, the rates of previously convicted persons to the total persons prosecuted for Stimulant Drug Control Law violations, Firearms and Swords Control Law violations, or Poisonous and Deleterious Substances Control Law violations were extremely high, exceeding 50% for each offense. As for the rate of persons prosecuted for committing an offense while they are under suspended sentence or on parole to the total persons prosecuted for the offense, it is high for larceny and breaking and entering in all penal code offenses, whereas it is highest for Stimulant Drug Law violations in all special law offenses. Table 1-3-1-3 Number of adult offenders cleared who have been previously convicted and the rate of persons cleared for offenses of the same kinds as those of which they have been previously convicted, by type of major offense (2001) Table 1-3-1-4 Number of prosecuted persons, number of previously convicted persons prosecuted, by type of major offense and their status at the time of the offense (2001) |