| Previous Next Index Image Index Year Selection | |
|
|
1 Outline The number of persons newly received by public prosecutors offices for the 10 most common special law offenses (including violations of ordinances) in 2001 is as follows:
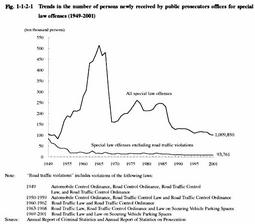
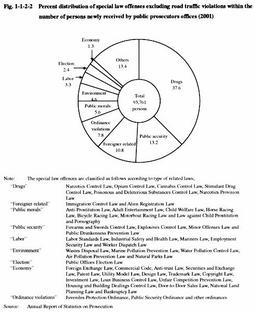
Principal data for 2001 (special law offenses) New cases* (percent distribution) (year-on-year change) [1] Road Traffic Law violations 890,969 (88.2%) (-16,853) [2] Stimulant Drug Control Law violations 26,496 (2.6%) (-1,472) [3] Vehicle Parking Spaces Law violations 25,120 (2.5%) (-4,618) [4] Immigration Control Law violations 10,106 (1.0%) (+2,284) [5] Minor Offenses Law violations 7,351 (0.7%) (+70) [6] Poisonous and Deleterious Substances Control 5,996 (0.6%) (-375) Law violations [7] Firearms and Swords Control Law violations 4,718 (0.5%) (+187) [8] Road Trucking Vehicle Law violations 3,912 (0.4%) (+210) [9] Wastes Disposal Law violations 3,811 (0.4%) (+909) [10] Public Offices Election Law violations 2,259 (0.2%) (+59) Others 29,112 (2.9%) Total 1,009,850 (100.0%) (-18,614) (Source: Annual Report of Statistics on Prosecution) New cases = Number of persons newly received by public prosecutors offices By type of offense, the number of persons newly received for Road Traffic Law violations and Vehicle Parking Spaces Law violations (together called "road traffic violations" in this white paper; see NOTES) accounted for 90.7% of the total number of persons newly received by public prosecutors offices for special law offenses and 41.5% of the total number of persons newly received by public prosecutors offices for all kinds of offenses including penal code offenses. Road Traffic Law violations do not include violations subject to the traffic violation notification system and for which a non-penal fine has already been paid. Fig. 1-1-2-1 shows the trends in the total number of persons newly received by public prosecutors offices for all special law offenses since 1949 and the total number of persons newly received by public prosecutors offices for special law offenses excluding road traffic violations since 1949. The total number of persons newly received by public prosecutors offices for all special law offenses showed a sharp fall after reaching a peak of 5,140,389 in 1965, and has been within the range of 1 million or over but below 1.5 million since 1988. The number of persons newly received by public prosecutors offices for special law offenses excluding road traffic violations has been fluctuating within the range of 80,000 or over but below 90,000 since 1992. Fig. 1-1-2-2 shows the percent distribution of persons newly received by public prosecutors offices for special law offenses other than road traffic violations, which are categorized as special law offenses related to drugs, foreigners, public morals, public security, labor, environment, election, economy, and others, and ordinance violations. Fig. 1-1-2-1 Trends in the number of persons newly received by public prosecutors offices for special law offenses (1949-2001) Fig. 1-1-2-2 Percent distribution of special law offenses excluding road traffic violations within the number of persons newly received by public prosecutors offices (2001) |