| Previous Next Index Image Index Year Selection | |
|
|
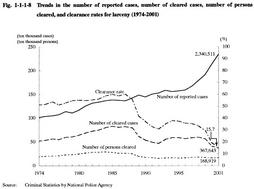
3 Trends in larceny Fig. 1-1-1-8 shows the trends in the number of reported cases, number of persons cleared, and crime rate for larceny. In 2001, the number of reported cases and clearance rates have continued to respectively rise and fall sharply, while the number of persons cleared took an upward turn contrary to the previous year. As for grand larceny, such as theft from houses, pick-pocketing, snatching, and car theft, the number of reported cases accounted for 18.9% of the total number of all reported cases, marking 443,502, yet clearance rates for grand larceny have remained at a higher level than those for all larcenies, at 27.1%.
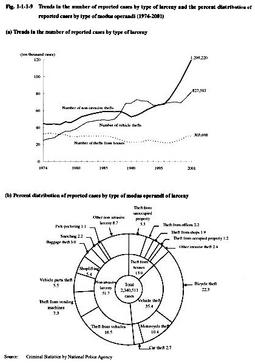
Fig. 1-1-1-8 Trends in the number of reported cases, number of cleared cases, number of persons cleared, and clearance rates for larceny (1974-2001) Fig. 1-1-1-9 Trends in the number of reported cases by type of larceny and the percent distribution of reported cases by type of modus operandi (1974-2001) Fig. 1-1-1-9 shows the trends in the number of reported cases by type of larceny and the percent distribution of reported cases by type of modus operandi in 2001. Theft from houses took an upward turn after having decreased for a long time, and non-invasive theft committed outdoors and vehicle thefts are increasing remarkably. This suggests that the rate of offenders who commit crimes outside houses to total offenders has been on the rise in larceny as well as in violent offenses (see Part 5, Chapter 2, Section 3 ). In particular, the percentages of vehicle thefts plus thefts from vehicles have exceeded 50% of the total percent distribution, and it can be considered that the rate of larceny committed outside houses to the total number of cases has increased due to the development of a car-oriented society.Regarding recent trends in larceny, such as the increase in reported larceny cases, please refer to articles in Part 4 of the "White Paper on Crime" published in 2001. |

