| Previous Next Index Image Index Year Selection | |
|
|
1 Outline The principal data concerning penal code offenses in 2001 are as follows:
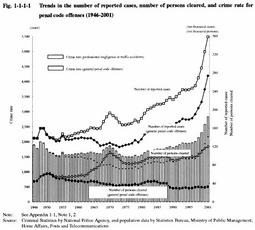
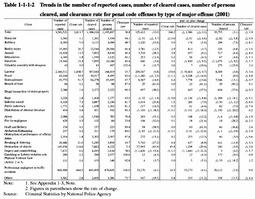
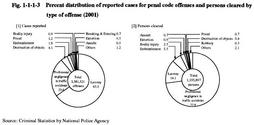
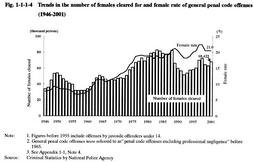
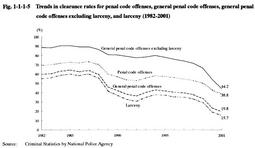
Principal data for 2001 (penal code offenses) (year-on-year change) [1] Number of reported cases 3,581,521 (+325,412) General penal code offenses 2,735,612 (+292,142) General penal code offenses excluding larceny 395,101 (+82,795) [2] Number of cleared cases 1,388,024 (-1,386) General penal code offenses 542,115 (-34,656) General penal code offenses excluding larceny 174,472 (+4,947) [3] Number of persons cleared 1,195,897 (+35,755) General penal code offenses 325,292 (+15,643) General penal code offenses excluding larceny 156,373 (+9,334) [4] Crime rate 2,814 (+248) General penal code offenses 2,149 (+224) General penal code offenses excluding larceny 310 (+64) [5] Clearance rate 38.8 (-3.9 points) General penal code offenses 19.8 (-3.8 points) General penal code offenses excluding larceny 44.2 (-10.1 points) (Source: Criminal Statistics by National Police Agency) Fig. 1-1-1-1 shows the trends in the number of reported cases, number of persons cleared, and crime rates (the number of reported cases per 100,000 persons; hereinafter the same in this section) for penal code offenses and general penal code offenses (penal code offenses excluding professional negligence in traffic accidents; hereinafter the same in this section) in Japan since 1946 (see Appendix 1-1 ). Table 1-1-1-2 shows the number of reported cases, etc. and year-on-year changes for penal code offenses in 2001, by type of offense (see Appendix 1-2 ). The number of reported penal code offenses has increased more or less consistently since 1975. The percentage change from the previous year has increased since 1996, and in 2001, it has registered a new postwar high for 6 consecutive years, increasing by 10.0% over the previous year. Fig. 1-1-1-3[1] shows the percent distribution of reported cases for penal code offenses in 2001 by type of offense, in which larceny and professional negligence in traffic accidents accounted for more than 80% of the total penal code offenses. Additionally, the two offenses together comprised the main part of the increase in the number of reported cases for penal code offenses. Crime rates for general penal code offenses and total penal code offenses have been on the rise almost continually since 1974 and since 1984 respectively. Fig. 1-1-1-1 Trends in the number of reported cases, number of persons cleared, and crime rate for penal code offenses (1946-2001) Table 1-1-1-2 Trends in the number of reported cases, number of cleared cases, number of persons cleared, and clearance rate for penal code offenses by type of major offense (2001) Additionally, by gender, the number of persons cleared per 100,000 persons aged 14 and over (population rate) was 479.5 for males and 120.5 for females in 2001. According to Fig. 1-1-1-5 , clearance rates for penal code offenses have been on the decline in recent years. In 2000 and 2001, the clearance rate recorded new postwar lows, which failed to reach 20% for the first time for general penal code offenses (see Appendix 1-3 ). Fig. 1-1-1-3 Percent distribution of reported cases for penal code offenses and persons cleared by type of offense (2001) Fig. 1-1-1-4 Trends in the number of females cleared for and female rate of general penal code offenses (1946-2001) Fig. 1-1-1-5 Trends in clearance rates for penal code offenses, general penal code offenses, general penal code offenses excluding larceny, and larceny (1982-2001) |