| Previous Next Index Image Index Year Selection | |
|
|
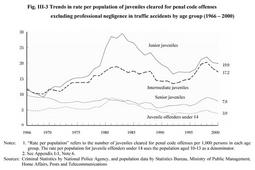
2. Trends by age group Fig. III-3 indicates the trends in the number of juveniles cleared for penal code offenses excluding professional negligence in traffic accidents by age group since 1966 (see Appendix III-2 ).
Fig. III-3 Trends in rate per population of juveniles cleared for penal code offenses excluding professional negligence in traffic accidents by age group (1966-2000) The rates per population for the number of juveniles cleared for penal code offenses by age group increased continuously for three years from 1996 for every age group. However, the rates took a downward trend in 1999. |
