| Previous Next Index Image Index Year Selection | |
|
|
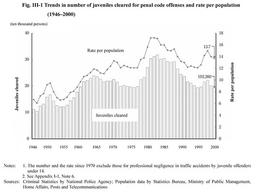
1. Trends in the number of cleared juveniles and relevant rates Fig. III-1 shows the trends in the number of juveniles cleared for penal code offenses and their rates (the number of cleared juvenile offenders per 1,000 persons aged 10 and over but less than 20) since 1946 (see Appendix III-1 ).
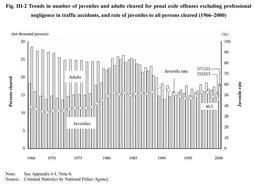
The trends in the number of juveniles cleared for penal code offenses indicate three cycles;the first peaking in 1951 at 166,433, the second in 1964 at 238,830, and the third in 1983 at 317,438. The number of juveniles cleared and relevant rates have shown increase and upward trends since 1996, but again showed a decrease and a downward trend in 1999. In 2000, the number of cleared juveniles reached 193,260 (down 4.2% from the previous year), equivalent to 13.7 per 1,000 juveniles (down 0.3% from the previous year). Fig. III-1 Trends in number of juveniles cleared for penal code offenses and rate per population (1946-2000) Although the number of juveniles cleared for penal code offenses other than professional negligence in traffic accidents increased from 1996 to 1998, it fell in 1999, and dropped to 152,813 (down 6.9% from the previous year)in 2000. The juvenile rate (the proportion of juveniles cleared for penal code offenses to the total number of persons cleared, including adults and juvenile offenders under 14) was 46.3% in 2000, which was below 50% for two consecutive years. Fig. III-2 Trends in number of juveniles and adults cleared for penal code offenses excluding professional negligence in traffic accidents, and rate of juveniles to all persons cleared (1966-2000) |