| Previous Next Index Image Index Year Selection | |
|
|
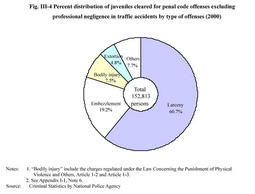
3. Trends by category of offenses Fig. III-4 shows the percent distribution of juveniles cleared for penal code offenses excluding professional negligence in traffic accidents by category of offenses in 2000. The large portion of the distribution consists of larceny, which is 60.7%. Embezzlement (including misappropriation of lost property)accounted for 19.2%, the greater portion of which constituted the riding away of parked bicycles. Also, examining the percent distribution of the juveniles cleared for penal code offenses by age group and category of offenses, the percentage for larceny was the highest at every age group. Above all, the figure for juvenile offenders under 14 was 72.5%, the highest of all (see Appendix III-3 ).
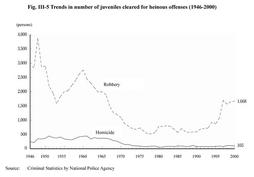
Fig. III-4 Percent distribution of juveniles cleared for penal code offenses excluding professional negligence in traffic accidents by type of offenses (2000) The number of juveniles cleared for heinous offenses per 100,000 persons (juveniles aged 10 and over but less than 20) for homicide has been shifting at a rate below 1.0 since 1971, with some fluctuation. In 2000, the rate was 0.74 (a drop of 0.03 from the previous year). As for robbery, the rates showed a downward trend since 1964, below 10.0 reaching, but they have shown an upward trend since 1989, reaching 11.20 in 1997. This means that it exceeded 10.0 for the first time in 33 years, reaching 11.82 in 2000 (a rise of 0.42 from the previous year) (see Appendix III-5 for the number of juveniles cleared for major penal code offenses per 100,000 persons). Fig. III-5 Trends in number of juveniles cleared for heinous offenses (1946-2000) |