| Previous Next Index Image Index Year Selection | |
|
|
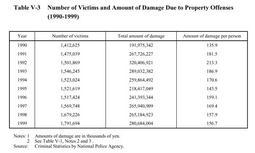
2 Property damage Table V-3 shows the number of victims, the total amount of damage and the amount of damage per person caused by property offenses(meaning, for the purpose of this Section, robbery, extortion, larceny, fraud and embezzlement including embezzlement of lost property)recognized by the police in the10-year period from1990. The number of victims increased gradually from1991,leveled off in1994,and turned up again in1997. In1999,it increased by112,468(6.7%)from the previous year.
The total and per capita amounts of damage both increased from1990to1992,started to decline in1993,rebounded in1996and turned down again in1998. In1999,the total amount increased5.8%from the previous year, while the per-capita amount fell by¥1,000to approximately¥157,000. Table V-3 Number of Victims and Amount of Damage Due to Property Offenses(1990-1999) |
