| Previous Next Index Image Index Year Selection | |
|
|
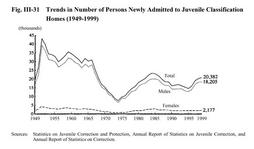
2 Admission and discharge Fig. III-31 shows trends in the number of persons newly admitted to juvenile classification homes since 1949.
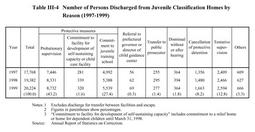
The number of newly admitted juveniles showed a downward trend from1985until1995,only to turn up in1996. In1999,it increased by961(4.9%)from the previous year to reach20,382(see Appendix III-12 ). Aside from commitment to a juvenile classification home as a measure of protective detention, reasons for admission to juvenile classification homes include protective detention in place of detention, as well as actual detention. In1999,the most common reason for admission to juvenile classification homes was protective detention, accounting for83.8%of newly admitted juveniles, followed by protective detention in place of detention with13.1%. Fig. III-31 Trends in Number of Persons Newly Admitted to Juvenile Classification Homes(1949-1999) Table III-4 Number of Persons Discharged from Juvenile Classification Homes by Reason(1997-1999) Table III-4 shows the number of persons discharged from juvenile classification homes in the last three years, by reason. In1999,probationary supervision was the most common reason for discharge from juvenile classification homes(43.2%), followed by commitment to a juvenile training school(27.4%), tentative supervision(12.8%), and cancellation of protective detention(8.2%). |

