2 Firearm offenses
(1) Violent conflict incidents
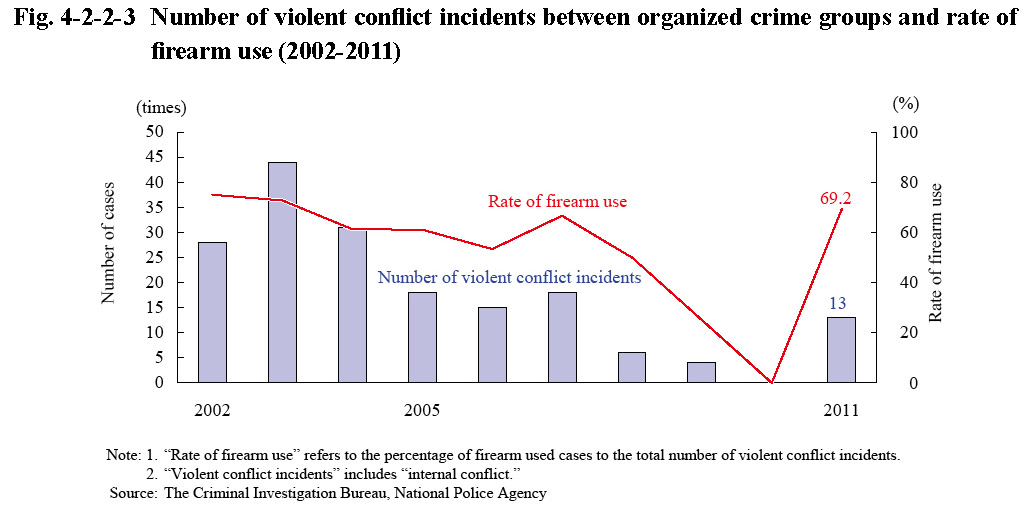
Fig. 4-2-2-3 shows the number of violent conflict incidents between organized crime groups and the rate of firearm (refers to handguns, rifles, machine guns, artillery, hunting guns, and other guns that have the function of firing metal bullets, and also air guns) use (the percentage of cases where firearms were used to total number of violent conflict incidents) over the last 10 years. The number of violent conflict incidents between organized crime groups was decreasing from 2008 but increased to 13 in 2011.
Fig. 4-2-2-3 Number of violent conflict incidents between organized crime groups and rate of firearm use (2002-2011)
(2) Firing incidents
Fig. 4-2-2-4 shows the number of firing incidents and persons killed in those incidents over the last 10 years.
Fig. 4-2-2-4 Number of firing incidents and persons killed (2002-2011)
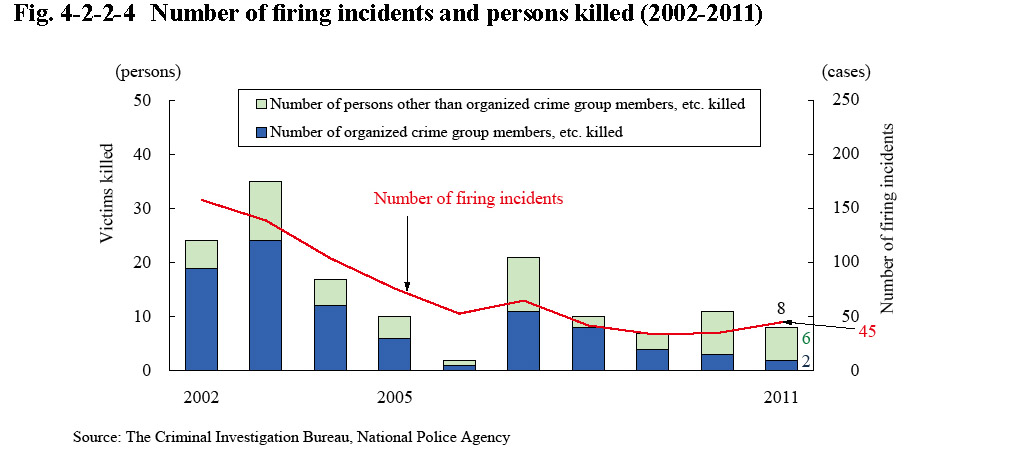
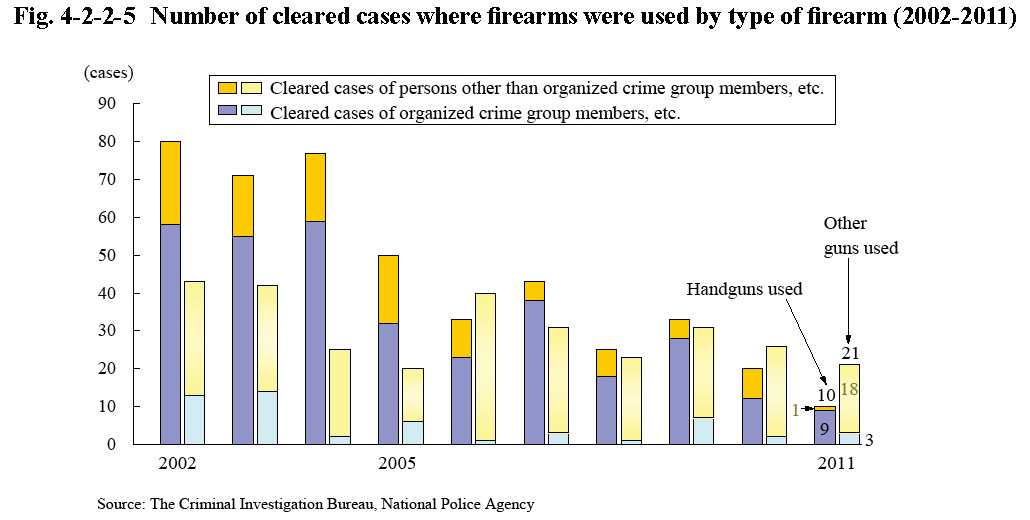
Fig. 4-2-2-5 shows the number of cleared cases where firearms were used by whether the firearms were handguns or other types of guns over the last 10 years.
Fig. 4-2-2-5 Number of cleared cases where firearms were used by type of firearm (2002-2011)
(3) Trends in handguns being seized
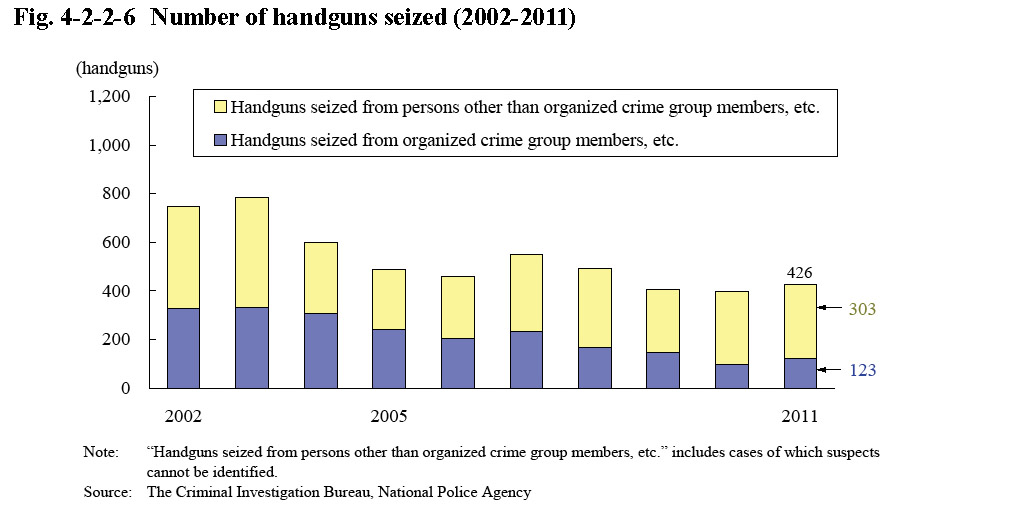
Fig. 4-2-2-6 shows the number of handguns seized over the last 10 years. The number of handguns seized in 2011 was 426 (up 29 or 7.3% from the previous year), of which 375 (88.0%) were genuine handguns and 123 (28.9%) were seized from organized crime group members, etc. (Source: The Criminal Investigation Bureau, National Police Agency).
Fig. 4-2-2-6 Number of handguns seized (2002-2011)