Section 3 Treatment
1 Prosecution
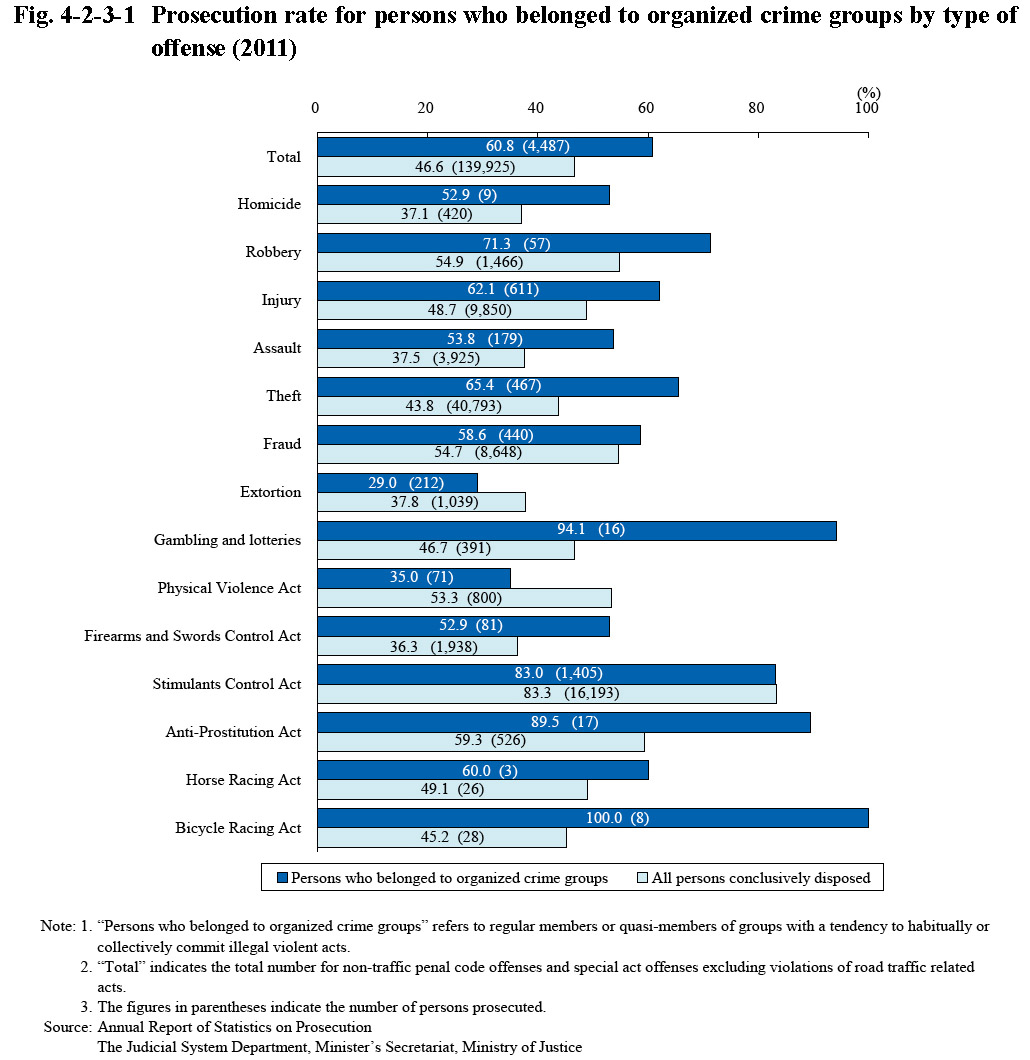
Fig. 4-2-3-1 shows the prosecution rate for persons who belonged to organized crime groups (refers to regular members and quasi-members of a group with a tendency to habitually or collectively commit illegal violent acts; hereinafter the same in this subsection) by type of offense in 2011 (See Appendix 2-3 for the prosecution rate over past years). The prosecution rate for persons who belonged to organized crime groups for total non-traffic penal code offenses and special act offenses excluding violations of road traffic related acts was remarkably high at 60.8% when compared to that for total persons conclusively disposed in public prosecutors offices at 46.6%.
Fig. 4-2-3-1 Prosecution rate for persons who belonged to organized crime groups by type of offense (2011)