2 History of protective measures with juveniles placed under protective measures
(1) Percent distribution by history of protective measures
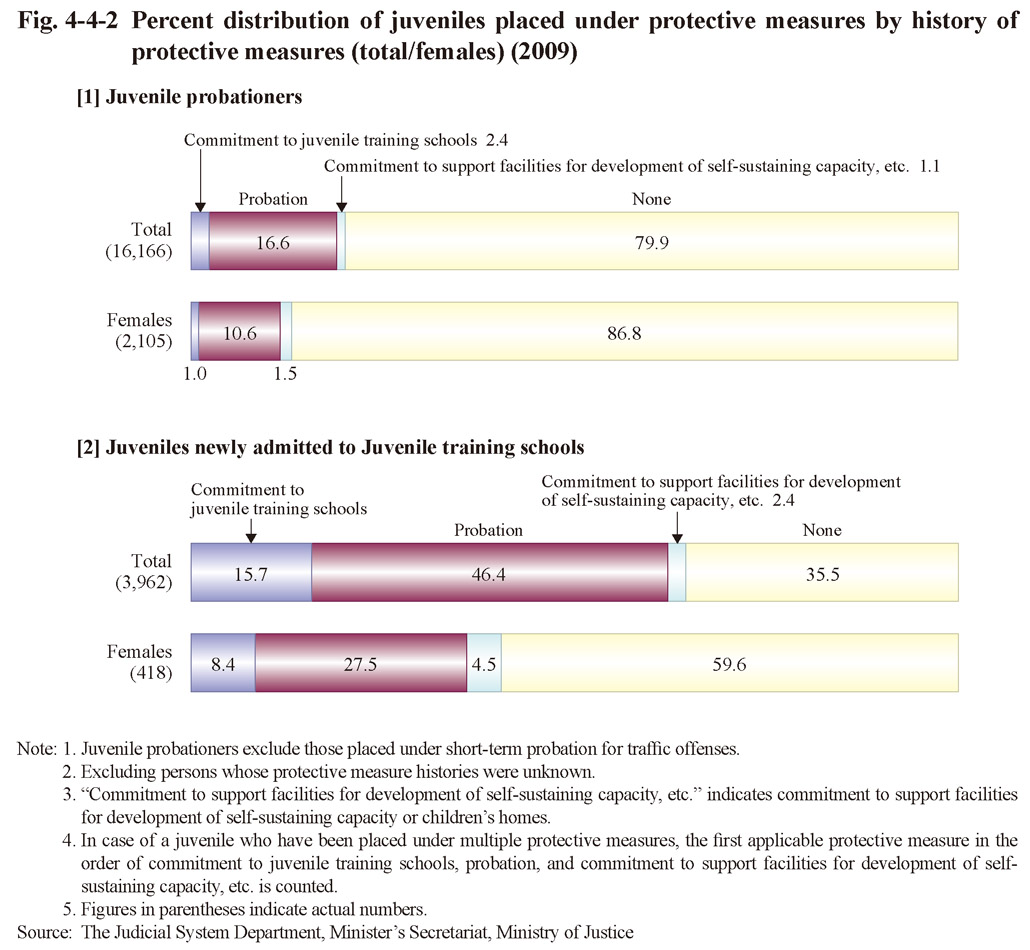
Fig. 4-4-2 shows the percent distribution of juvenile probationers (excluding those placed under short-term probation for traffic offenses; hereinafter the same in this chapter) and juveniles newly admitted to juvenile training schools in 2009 by history of the protective measures. Juveniles with a history of protective measures accounted for approximately 20% of juvenile probationers and approximately 65% of juveniles newly admitted to juvenile training schools.
Fig. 4-4-2 Percent distribution of juveniles placed under protective measures by history of protective measures (total/females) (2009)
(2) Type of delinquency
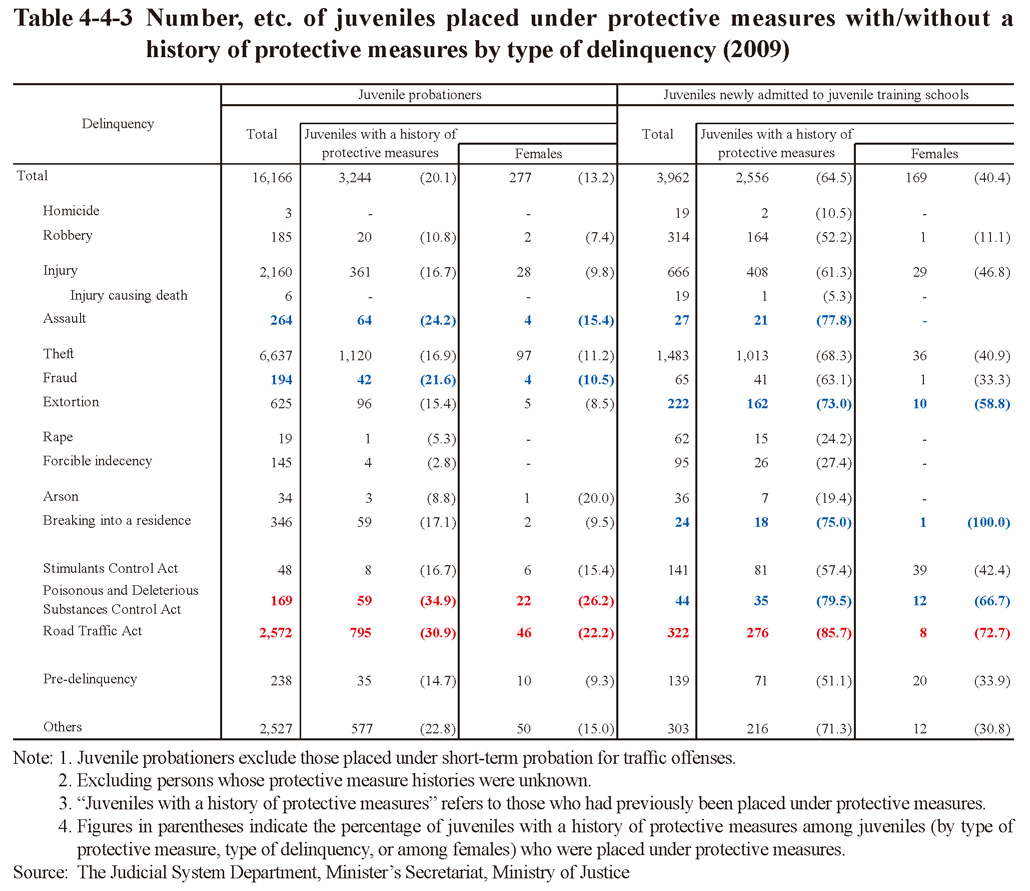
Table 4-4-3 shows the number of juvenile probationers and juveniles newly admitted to juvenile training schools with a history of protective measures (refers to those who had previously been placed under protective measures; hereinafter the same in this subsection) by type of delinquency in 2009. The percentage of juveniles with a history of protective measures was high for Poisonous and Deleterious Substances Control Act violations, Road Traffic Act violations, and assault, in that order, among juvenile probationers. In the case of juveniles newly admitted to juvenile training schools the proportion was high for Road Traffic Act violations, Poisonous and Deleterious Substances Control Act violations, assault, breaking into a residence, and extortion, in that order.
Table 4-4-3 Number, etc. of juveniles placed under protective measures with/without a history of protective measures by type of delinquency (2009)