Chapter 4 Trends with Repeat Delinquencies and Juveniles with a History of Delinquency
1 Repeat delinquencies by juveniles
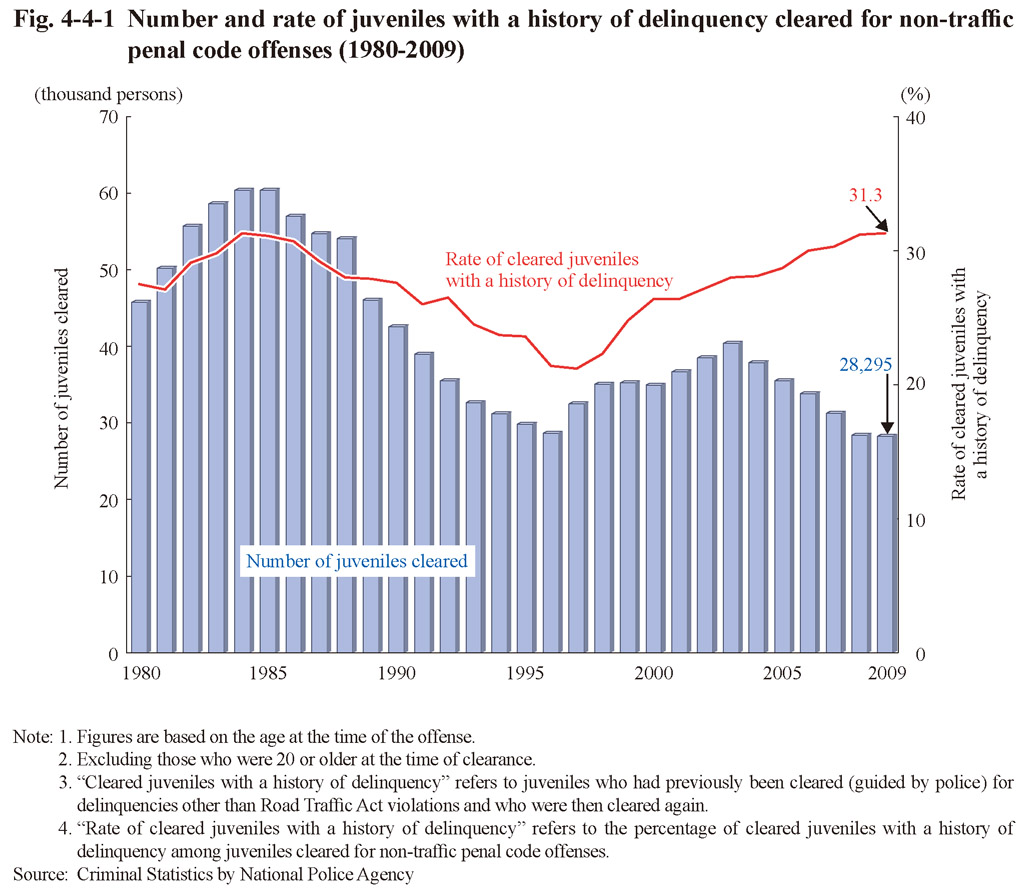
Fig. 4-4-1 shows the number of cleared juveniles with a history of delinquency (refers to juveniles who had previously been cleared (guided by the police) for delinquencies other than Road Traffic Act violations and who were then cleared again; hereinafter the same in this subsection) and the rate of cleared juveniles with a history of delinquency (refers to the percentage of juveniles with a history of delinquency among juveniles cleared for non-traffic penal code offenses; hereinafter the same in this subsection) over the last 30 years. The number of juveniles with a history of delinquency decreased every year between 2004 and 2009, but the rate of cleared juveniles with a history of delinquency then actually rose every year after reaching a minimum in 1997.
Fig. 4-4-1 Number and rate of juveniles with a history of delinquency cleared for non-traffic penal code offenses (1980-2009)