| Previous Next Index Image Index Year Selection | |
|
|
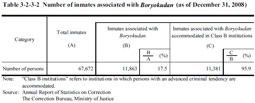
2 Correction (1) Inmates associated with BoryokudanTable 3-2-3-2 shows the number and percentage of inmates associated with Boryokudan (refers to regular members and quasi-members of designated Boryokudan, etc. designated under the Anti-Boryokudan Act at the time of the offense; hereinafter the same in this subsection) as of December 31, 2008. Table 3-2-3-2 Number of inmates associated with Boryokudan (as of December 31, 2008)
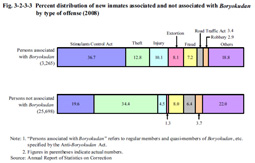
(2) Characteristics of inmates associated with Boryokudan The number of inmates associated with Boryokudan admitted in 2008 was 3,265 (11.3% of total new inmates). Of them 1,019 were group leaders, 1,898 were regular members, and 348 were of unknown status (Source: Annual Report of Statistics on Correction). a. Age Examining the percent distribution of new inmates associated with Boryokudan in 2008 by age group revealed that those aged 30-39 were the highest in proportion at 35.5%, followed by those aged 40-49 (27.4%), those aged 20-29 (15.7%), those aged 50-59 (13.7%), and those aged 60 or older (7.6%) (Source: Annual Report of Statistics on Correction). b. Type of offense Fig. 3-2-3-3 shows the percent distribution of new inmates associated with and not associated with Boryokudan in 2008 by type of offense. The proportion of Stimulants Control Act violations, injury, and extortion was high while that of theft was significantly low among those associated with Boryokudan when compared to those not associated with them. Fig. 3-2-3-3 Percent distribution of new inmates associated and not associated with Boryokudan by type of offense (2008)
Examining the term of imprisonment of new inmates associated with Boryokudan in 2008 revealed that those sentenced to imprisonment for “over one year but not more than two years” were the highest in proportion at 34.8%, followed by “over two years but not more than three years” at 27.7%, “over three years but not more than five years” at 15.4%, “over six months but not more than one year” at 11.6%, over five years (including life imprisonment) at 8.1%, and not more than six months at 2.5%. The proportion of imprisonment term of “over two years but not more than three years,” “over three years but not more than five years,” and over five years (including life imprisonment) was higher among those associated with Boryokudan than that of all inmates (Source: Annual Report of Statistics on Correction). d. History of imprisonment Examining the history of imprisonment of new inmates associated with Boryokudan in 2008 revealed that those imprisoned for the “first time” were the highest in proportion at 25.2%, followed by those imprisoned “twice” at 19.9%, “three times” at 15.5%, “four times” at 11.5%, “five times” at 8.2%, “six to nine times” at 14.5%, and “10 times or more” at 5.2%. The proportion of each history of imprisonment except for the “first time” was higher among those associated with Boryokudan than that of all inmates (Source: Annual Report of Statistics on Correction). |