| Previous Next Index Image Index Year Selection | |
|
|
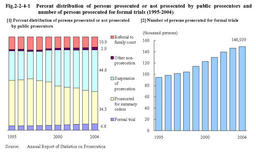
Fig.2-2-4-1 shows the changes in percentage distribution of persons prosecuted or not prosecuted and the number of persons prosecuted for formal trials in the last ten years.
In2004,the total number of persons finally disposed was2,183,811.The number of persons prosecuted for formal trials was148,939(6.8%of the total),those who were prosecuted for summary trial procedure was754,128(34.5%),those who were granted suspension of prosecution was977,616(44.8%),those not prosecuted for other reasons was64,054(2.9%),and those referred to family courts was239,074(10.9%),(see Appendix2-2 ). Fig.2-2-4-1 Percent distribution of persons prosecuted or not prosecuted by public prosecutors and number of persons prosecuted for formal trials(1995-2004) Fig.2-2-4-2 Prosecution rates by type of offense(1985-2004) Fig.2-2-4-3 Suspended prosecution rates by type of offense(1985-2004) Table2-2-4-4 Number of suspects who were not prosecuted,by reason(1995-2004) |